Stock Analysis · Nasdaq Inc (NDAQ)
Overview
Nasdaq Inc. is best known for operating the Nasdaq stock exchange, but the company is much broader than a stock market. It runs trading venues for equities, options, fixed income, commodities, and derivatives; provides market data and indexes; offers software used by exchanges, regulators, and financial institutions; and owns anti-financial-crime, governance, and compliance platforms. In simple terms, Nasdaq makes money both from financial market activity and from selling technology that helps other institutions run markets and manage risk.
Its business mix has become more diversified over time, which matters because it reduces dependence on daily trading volumes. Based on recent annual reporting structure, the largest revenue sources are approximately:
- Financial Technology: about 31% of revenue. This includes market infrastructure software, anti-financial-crime tools, regulatory technology, and governance solutions sold to exchanges, banks, brokers, and corporations.
- Capital Access Platforms: about 27%. This includes indexing, analytics, investor relations, ESG and board solutions, and workflow tools used by asset managers and listed companies.
- Market Services: about 26%. This covers cash equities, equity derivatives, fixed income and commodities trading, clearing, settlement, and trade management services.
- Listing Services: about 16%. This includes initial and annual listing fees paid by companies listed on Nasdaq’s exchanges.
That mix shows why Nasdaq is no longer just an exchange operator. A meaningful portion of its revenue now comes from recurring software, data, and subscription-like services, which are usually steadier than transaction-based businesses. The profit flow also points to a business with operating leverage: revenue has expanded materially in recent years, while earnings improved sharply after a softer 2023.
The long-term picture shows revenue moving from roughly $5.9 billion in 2021 to more than $8.2 billion in 2025, with operating income and net income also rising over that period. One notable positive is that interest expense dropped sharply in 2025, which helped bottom-line profit recover strongly.
Key Figures
| Metric | Value | Sector ⓘ |
|---|---|---|
| Date | Oct 24, 2026 | |
| Context | ||
| Sector | Financial Services | |
| Industry | Financial Data & Stock Exchanges | |
| Market Cap ⓘ | $53.73B | |
| Beta ⓘ | 1.00 | |
Value (Cheapness) | ||
| P/E Ratio ⓘ | 27.62 | 12.46 |
| P/B Ratio ⓘ | 4.89 | 1.25 |
| FCF Yield ⓘ | 3.63% | 9.82% |
| Dividend Yield ⓘ | 1.18% | 2.94% |
| EBIT / EV ⓘ | 4.25% | 8.11% |
| PEG ⓘ | 1.76 | |
Growth (Business expansion) | ||
| Revenue Growth ⓘ | 14.90% | 9.10% |
| RPS Growth (5Y CAGR) ⓘ | 5.17% | 12.31% |
| EPS Growth (5Y CAGR) ⓘ | 3.79% | -6.97% |
| BVPS Growth (5Y CAGR) ⓘ | 13.80% | 5.02% |
| Margin Growth (5Y Trend) ⓘ | 2.33% | -4.00% |
| FCF Growth (5Y CAGR) ⓘ | 21.26% | 4.71% |
| DPS Growth (5Y CAGR) ⓘ | 10.75% | 8.92% |
Quality (Business durability) | ||
| ROIC (Latest) ⓘ | 9.80% | 9.18% |
| ROE (Latest) ⓘ | 16.40% | 13.93% |
| ROA (Latest) ⓘ | 6.79% | 1.57% |
| ROIC (5Y Median) ⓘ | 9.93% | 7.80% |
| ROE (5Y Median) ⓘ | 15.29% | 12.15% |
| ROA (5Y Median) ⓘ | 5.49% | 1.28% |
| Net Debt / EBIT (Latest) ⓘ | 3.43 | 1.02 |
| Net Debt / EBIT (5Y Median) ⓘ | 3.65 | 0.72 |
| Net Debt / EBITDA (Latest) ⓘ | 2.73 | 0.88 |
| Operating Margin (Latest) ⓘ | 29.19% | 22.30% |
| Operating Margin (5Y Median) ⓘ | 27.59% | 24.50% |
| Debt to Equity (Latest) ⓘ | 77.10% | 59.34% |
| Profit Margin (Latest) ⓘ | 35.04% | 26.42% |
| Free Cash Flow (Latest) ⓘ | $1.95B | |
Momentum (Price trend) | ||
| 3Y Return ⓘ | +115.88% | +95.73% |
| 12M Return (excl. last month) ⓘ | +6.47% | +17.30% |
| 6M Return ⓘ | +20.44% | +6.07% |
| Price vs. 200-Day MA ⓘ | +14.84% | +5.36% |
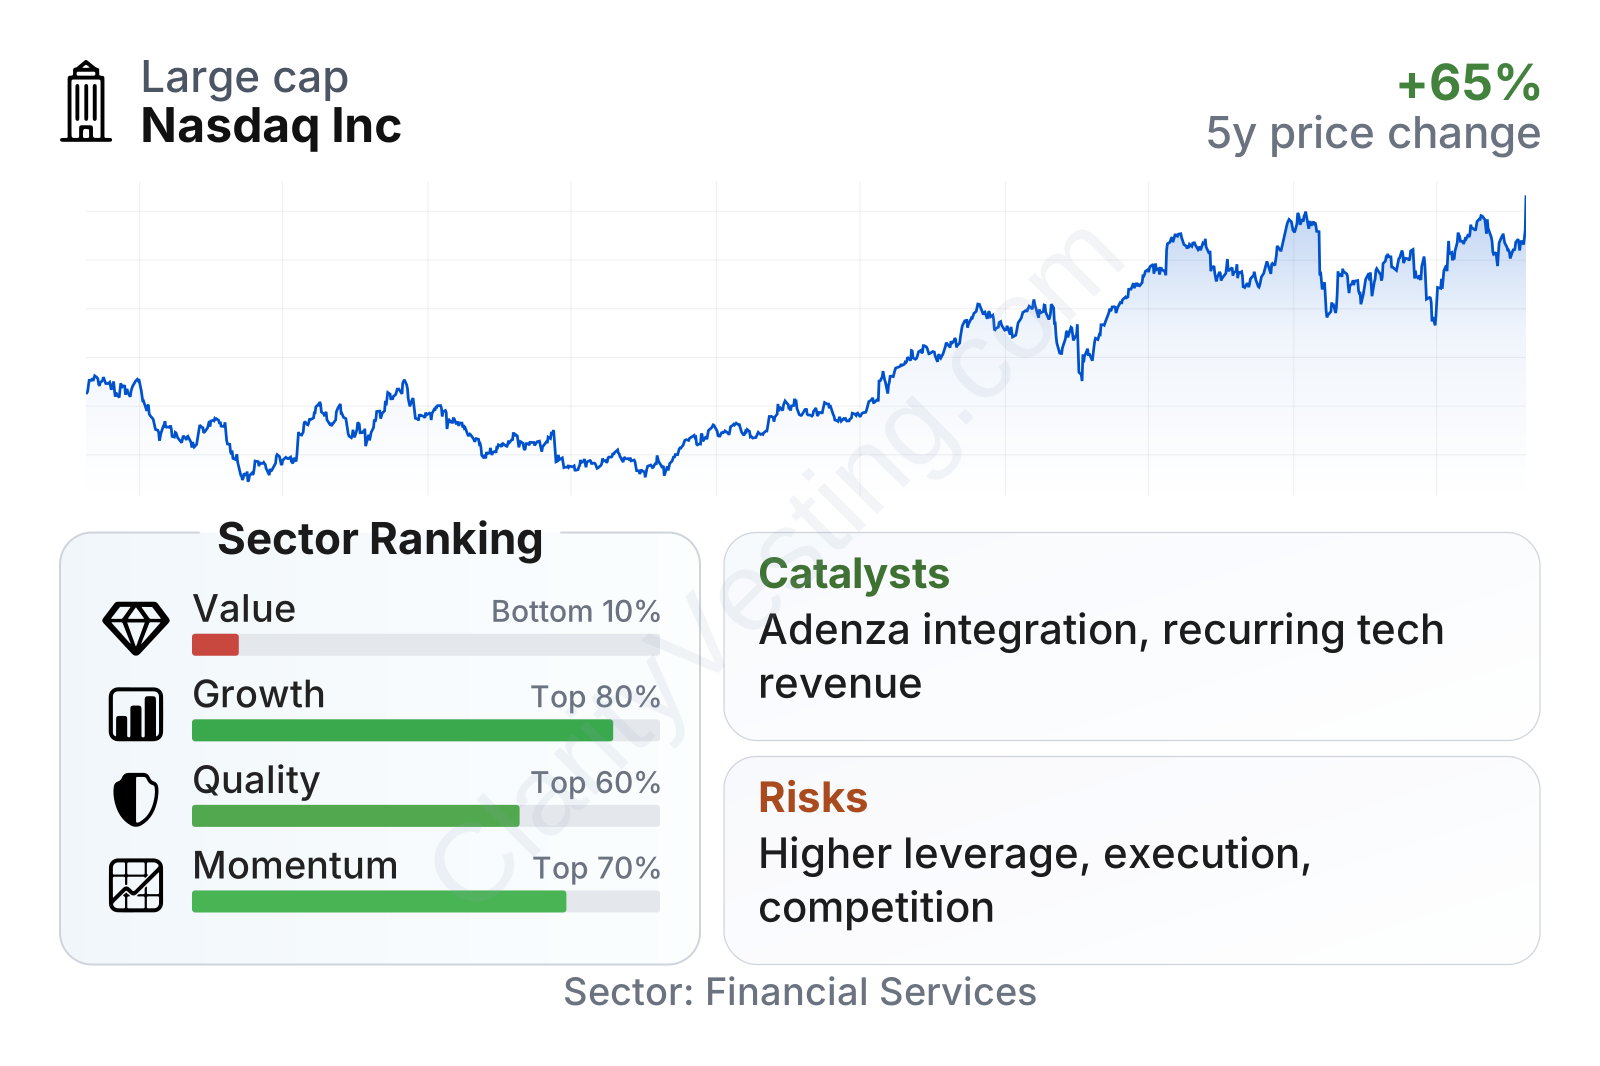
Nasdaq is a large financial infrastructure company with a stock market value above $50 billion and a share price pattern that has generally trended upward over the last several years, although with normal volatility along the way. The quality profile stands out more than the value profile: profitability measures are above sector medians, while valuation multiples are also clearly above sector norms. Growth is respectable rather than exceptional overall, with strong recent revenue expansion and very solid free cash flow progress, but more moderate five-year revenue-per-share growth. Momentum is mixed, suggesting the stock’s recent performance has been positive but not among the stronger names in the broader financial sector.
Growth
Nasdaq operates in a sector with durable long-term demand drivers. Financial markets continue to electronify, regulation remains complex, and institutions increasingly need data, surveillance, compliance software, and workflow automation. Those trends support Nasdaq’s strategy of moving beyond pure exchange revenue toward higher-value technology and information services. That direction makes strategic sense because software and data businesses can scale well, often carry recurring revenue, and are less tied to short-term swings in trading activity.
A major part of the growth case is the integration of the Adenza acquisition, which expanded Nasdaq’s presence in mission-critical software for banks and capital markets firms. It strengthened the company in risk management, regulatory reporting, and treasury solutions, making Nasdaq more relevant to large financial institutions outside its traditional exchange footprint. If execution remains solid, this can deepen cross-selling opportunities across data, trading, surveillance, and compliance.
Earnings per share show a business that has kept moving forward despite some uneven periods. After gradual improvement from 2021 through 2023, results were roughly flat in 2024 and then stepped up more meaningfully in 2025. That pattern fits a company digesting acquisitions and then beginning to translate scale into stronger profit growth.
Book value per share has also improved materially over the past five years, even with some fluctuations after acquisition-related balance sheet changes. This matters because it suggests Nasdaq has been adding underlying economic capacity while expanding its platform. In the broader growth picture, the company’s free cash flow trend looks especially encouraging, with a five-year growth rate far ahead of the sector median.
Recent company updates have also highlighted continued wins in market technology, modernization projects, and broader adoption of compliance and anti-financial-crime tools. Those are attractive areas because customers tend to be deeply embedded once systems are installed, which can support retention and recurring revenue. Another structural catalyst is the continued rise of private markets, index-linked products, and outsourced market infrastructure, all areas where Nasdaq has relevant products and relationships.
Risks
This article is for informational purposes only and does not constitute financial advice. Some content is AI-generated. See Disclaimer


