Stock Analysis · NCR Corp Pref A (NCRRP)
Overview
NCR Corp Pref A is a preferred security linked to NCR, a long-established technology company focused on software, services, and hardware used by banks, retailers, and restaurants. In practical terms, NCR helps businesses run everyday transactions: it provides point-of-sale systems for stores and restaurants, software for managing operations, self-service kiosks and checkout systems, and banking technology such as ATMs and digital banking tools.
After the separation of its ATM-focused business in recent years, NCR has become more concentrated around commerce software and services. That means the business mix is now more tied to restaurant technology, retail store systems, payment-related software, and recurring support contracts rather than a broad conglomerate model.
Based on the company’s recent annual disclosures, revenue is mainly generated from a mix of software, services, and product sales. The exact split can move from year to year, but the broad structure is as follows:
- Services: approximately 40% to 45% of revenue. This generally includes maintenance, implementation, managed services, and support contracts.
- Product sales: approximately 30% to 35% of revenue. This includes hardware such as checkout systems, kiosks, terminals, and related equipment.
- Software and subscriptions: approximately 20% to 25% of revenue. This includes cloud software, operational software for restaurants and retailers, and recurring software arrangements.
The business is global, but a large share of revenue still comes from the United States, with additional exposure to other developed markets. For long-term analysis, the important point is that NCR is no longer just a hardware provider: it is trying to shift toward more recurring, software-led revenue streams, which usually carry better margins and more predictable customer retention than one-time equipment sales.
The multi-year financial flow also shows a notable transition period. Revenue has trended lower since 2021, while cost of revenue and selling expenses have also come down. Profitability has been uneven, with a recovery in operating income only appearing recently after several years of pressure.
Key Figures
| Metric | Value | Sector ⓘ |
|---|---|---|
| Date | Oct 24, 2026 | |
| Context | ||
| Sector | Real Estate | |
| Industry | REIT - Residential | |
| Market Cap ⓘ | $121.64B | |
| Beta ⓘ | N/A | |
Value (Cheapness) | ||
| P/E Ratio ⓘ | N/A | 17.85 |
| P/B Ratio ⓘ | 121.87 | 0.87 |
| FCF Yield ⓘ | -0.09% | 7.30% |
| Dividend Yield ⓘ | N/A | 4.83% |
| EBIT / EV ⓘ | N/A | 3.78% |
| PEG ⓘ | N/A | |
Growth (Business expansion) | ||
| Revenue Growth ⓘ | N/A | 5.35% |
| RPS Growth (5Y CAGR) ⓘ | -7.98% | 6.02% |
| EPS Growth (5Y CAGR) ⓘ | N/A | -10.65% |
| BVPS Growth (5Y CAGR) ⓘ | -7.09% | 0.43% |
| Margin Growth (5Y Trend) ⓘ | N/A | -0.69% |
| FCF Growth (5Y CAGR) ⓘ | N/A | 5.40% |
| DPS Growth (5Y CAGR) ⓘ | -0.37% | 5.07% |
Quality (Business durability) | ||
| ROIC (Latest) ⓘ | 5.69% | 5.69% |
| ROE (Latest) ⓘ | 6.73% | 7.37% |
| ROA (Latest) ⓘ | 1.94% | 2.85% |
| ROIC (5Y Median) ⓘ | -0.41% | 4.26% |
| ROE (5Y Median) ⓘ | 3.66% | 6.04% |
| ROA (5Y Median) ⓘ | 0.97% | 2.45% |
| Net Debt / EBIT (Latest) ⓘ | 72.00 | 7.55 |
| Net Debt / EBIT (5Y Median) ⓘ | N/A | 8.26 |
| Net Debt / EBITDA (Latest) ⓘ | 3.76 | 5.26 |
| Net Debt / Assets ⓘ | 22.43% | 37.45% |
| EBITDA / Interest ⓘ | 2.67 | 4.11 |
| Operating Margin (Latest) ⓘ | 0.47% | 33.86% |
| Operating Margin (5Y Median) ⓘ | -1.01% | 37.49% |
| Debt to Equity (Latest) ⓘ | 97.18% | 88.76% |
| Profit Margin (Latest) ⓘ | N/A | 18.94% |
| Free Cash Flow (Latest) ⓘ | -$107.00M | |
Momentum (Price trend) | ||
| 3Y Return ⓘ | +38.32% | +36.33% |
| 12M Return (excl. last month) ⓘ | -1.68% | +4.32% |
| 6M Return ⓘ | +2.80% | -1.74% |
| Price vs. 200-Day MA ⓘ | -0.16% | -1.42% |
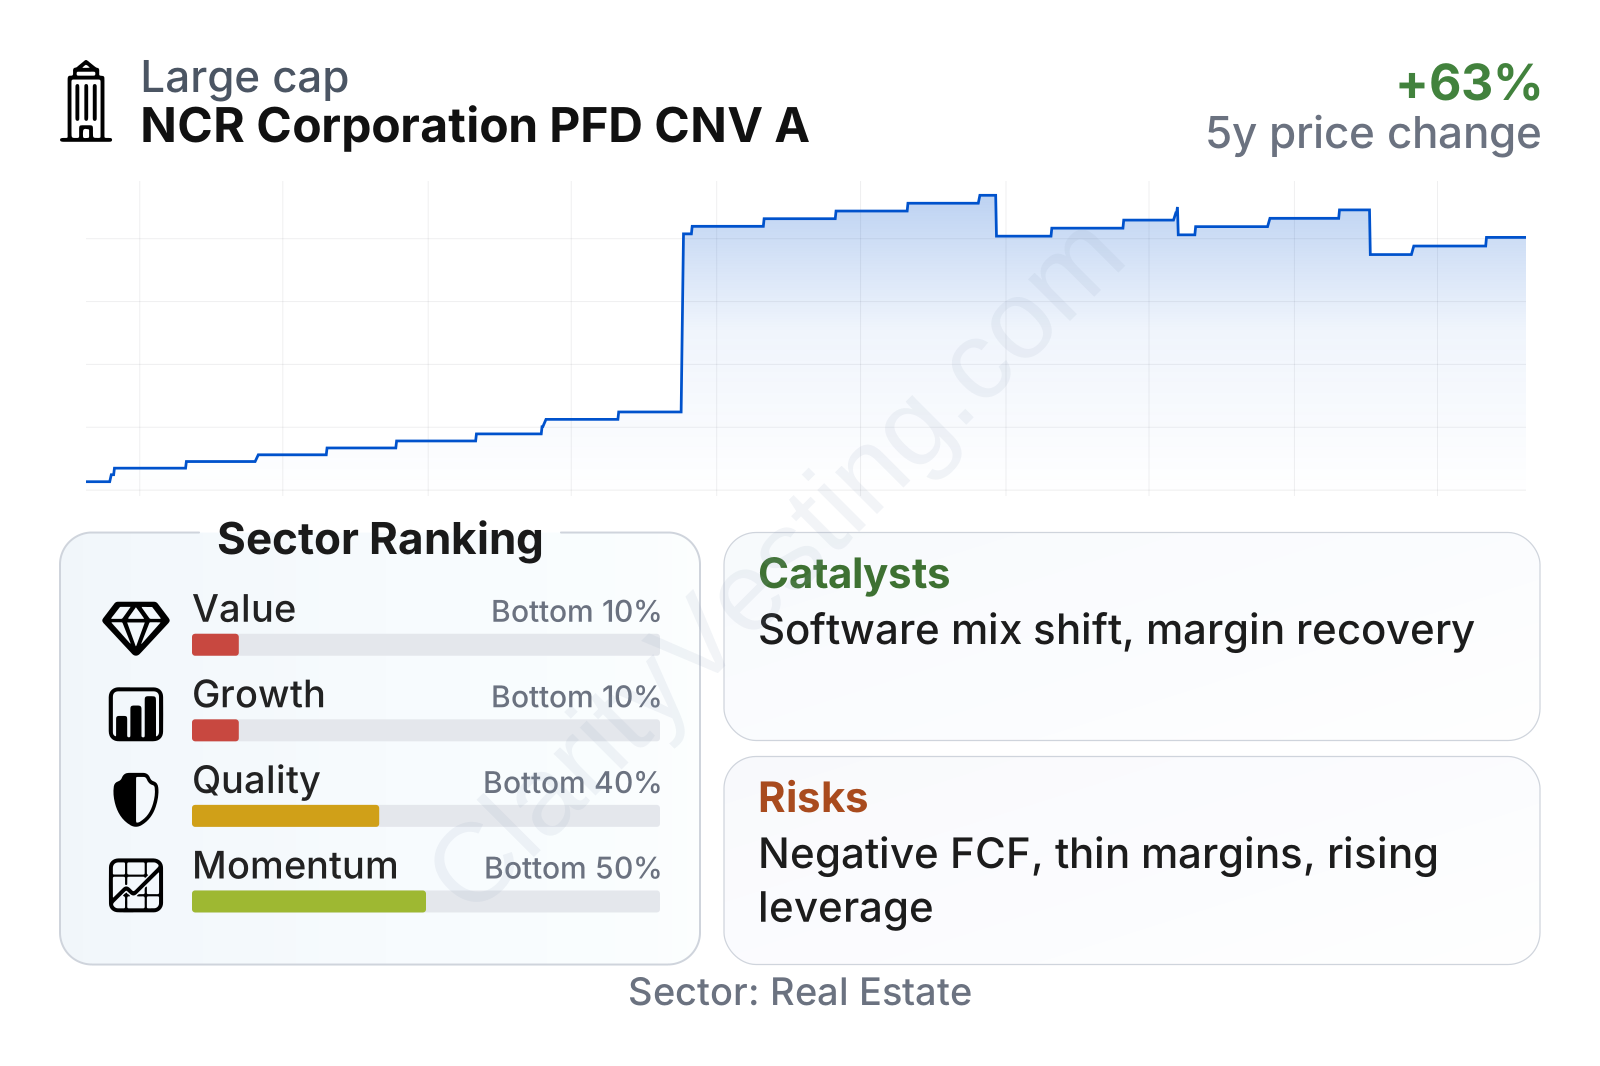
The overall profile shown by the latest metrics is weak relative to its sector comparison group. Value and growth rank near the bottom, mainly because earnings are thin, free cash flow has turned negative, and long-term revenue per share has declined. Quality is also below average, although not as severely, with returns on capital and assets trailing the sector median. Market performance has been mixed: the longer-term share-price trend has been positive, but shorter-term momentum has softened.
The historical price chart suggests a security that rose sharply through 2024 and then moved more sideways with some pullback in 2026. That pattern often reflects a market that already recognized major restructuring steps, while still waiting for more consistent operating results.
Growth
NCR operates in markets that are still relevant for long-term demand. Restaurants continue to digitize ordering and kitchen workflows, retailers keep investing in store automation and self-checkout, and businesses in general want more software embedded into daily transactions. These are supportive industry themes because they are tied to efficiency, labor savings, and customer convenience rather than short-lived trends.
The company’s strategy also makes sense on paper. Management has been pushing NCR toward a more software-and-services-heavy model, which is usually more attractive than depending primarily on hardware shipments. Software subscriptions and recurring service contracts can deepen customer relationships and create switching costs once NCR systems are built into store or restaurant operations.
That said, the recent numbers show that the turnaround is still incomplete. Revenue per share has been moving downward for several years, which means the business has not yet translated its strategic repositioning into visible top-line expansion on a per-share basis.
Preferred shareholders may also pay attention to distribution stability, even if the current yield is extremely low relative to typical income-oriented securities. Dividend per share has been broadly flat over time rather than expanding, so this security does not currently stand out as a rising-income instrument.
A major potential catalyst is the company’s ability to improve margins as it simplifies the portfolio and leans further into recurring software and payments-related activity. The 2025 operating result turning positive after prior losses is a useful sign, even if the margin remains very small. Another positive factor is that interest expense dropped sharply from earlier peaks, which can ease pressure on earnings if operating income continues to recover.
Recent company communications have continued to emphasize operational simplification, product focus, and software-led offerings. If those efforts convert into steadier recurring revenue and better profitability, the growth profile could look stronger than the recent history suggests. For now, the sector opportunity is real, but company-specific execution remains the deciding factor.
Risks
This article is for informational purposes only and does not constitute financial advice. Some content is AI-generated. See Disclaimer


