Stock Analysis · NBT Bancorp Inc (NBTB)
Overview
NBT Bancorp is a regional bank headquartered in the Northeast of the United States. Through NBT Bank and related subsidiaries, it provides traditional banking services to consumers, small businesses, middle-market companies, and public-sector clients. Its branch network is concentrated in New York, Pennsylvania, Vermont, Massachusetts, New Hampshire, Maine, and Connecticut, and its business model is built around gathering deposits locally and lending those funds back into the same markets.
Like most regional banks, NBT Bancorp earns most of its money from the spread between what it earns on loans and securities and what it pays on deposits and borrowings. It also has a meaningful fee business that helps diversify results when lending conditions are less favorable. Based on the company’s recent reporting structure, the main revenue sources can be summarized as follows:
- Net interest income: approximately 75% to 85% of total revenue. This is the core banking engine and includes interest earned on commercial loans, residential real estate loans, consumer loans, and investment securities, minus interest paid on deposits and other funding.
- Wealth management and trust fees: approximately 5% to 10%. This includes trust administration, investment management, retirement plan services, and related advisory activities.
- Service charges and deposit-related fees: approximately 3% to 7%. These come from account fees, transaction services, overdraft-related charges, and treasury management services.
- Card, payments, and merchant processing fees: approximately 2% to 5%. These include debit card interchange, merchant services, and payment-related activity.
- Insurance, retirement plan administration, and other fee income: approximately 3% to 8%. This covers insurance commissions, employee benefit services, and various banking-related fees.
NBT is not a national banking giant, but it is also not a tiny single-market bank. That middle position matters: it is large enough to spread technology and compliance costs across a broader base, while still operating in community-oriented markets where local relationships remain important. Over the last several years, revenue has expanded meaningfully, although profitability has been pressured at times by higher funding costs and the normal earnings swings that come with banking cycles.
The long-term picture shows a bank that has been growing revenue steadily, while expenses and funding costs have also moved up. Net income has recovered from the 2023 pressure point, but the path has not been perfectly smooth, which is typical for a deposit-funded lender operating through a changing rate environment.
Key Figures
| Metric | Value | Sector ⓘ |
|---|---|---|
| Date | Oct 24, 2026 | |
| Context | ||
| Sector | Financial Services | |
| Industry | Banks - Regional | |
| Market Cap ⓘ | $2.67B | |
| Beta ⓘ | 0.49 | |
Value (Cheapness) | ||
| P/E Ratio ⓘ | 12.58 | 12.46 |
| P/B Ratio ⓘ | 1.42 | 1.25 |
| FCF Yield ⓘ | 9.19% | 9.82% |
| Dividend Yield ⓘ | 2.87% | 2.94% |
| EBIT / EV ⓘ | 9.73% | 8.11% |
| PEG ⓘ | 2.66 | |
Growth (Business expansion) | ||
| Revenue Growth ⓘ | 17.80% | 9.10% |
| RPS Growth (5Y CAGR) ⓘ | 10.79% | 12.31% |
| EPS Growth (5Y CAGR) ⓘ | -14.36% | -6.97% |
| BVPS Growth (5Y CAGR) ⓘ | 6.84% | 5.02% |
| Margin Growth (5Y Trend) ⓘ | -15.10% | -4.00% |
| FCF Growth (5Y CAGR) ⓘ | 9.93% | 4.71% |
| DPS Growth (5Y CAGR) ⓘ | 6.92% | 8.92% |
Quality (Business durability) | ||
| ROIC (Latest) ⓘ | 10.13% | 9.18% |
| ROE (Latest) ⓘ | 11.28% | 13.93% |
| ROA (Latest) ⓘ | 1.32% | 1.57% |
| ROIC (5Y Median) ⓘ | 8.75% | 7.80% |
| ROE (5Y Median) ⓘ | 9.89% | 12.15% |
| ROA (5Y Median) ⓘ | 1.14% | 1.28% |
| Net Debt / EBIT (Latest) ⓘ | 1.02 | 1.02 |
| Net Debt / EBIT (5Y Median) ⓘ | 0.73 | 0.72 |
| Net Debt / EBITDA (Latest) ⓘ | 0.91 | 0.88 |
| Operating Margin (Latest) ⓘ | 29.34% | 22.30% |
| Operating Margin (5Y Median) ⓘ | 25.30% | 24.50% |
| Debt to Equity (Latest) ⓘ | 24.24% | 59.34% |
| Profit Margin (Latest) ⓘ | 29.59% | 26.42% |
| Free Cash Flow (Latest) ⓘ | $245.61M | |
Momentum (Price trend) | ||
| 3Y Return ⓘ | +85.60% | +95.73% |
| 12M Return (excl. last month) ⓘ | +22.77% | +17.30% |
| 6M Return ⓘ | +19.93% | +6.07% |
| Price vs. 200-Day MA ⓘ | +12.65% | +5.36% |
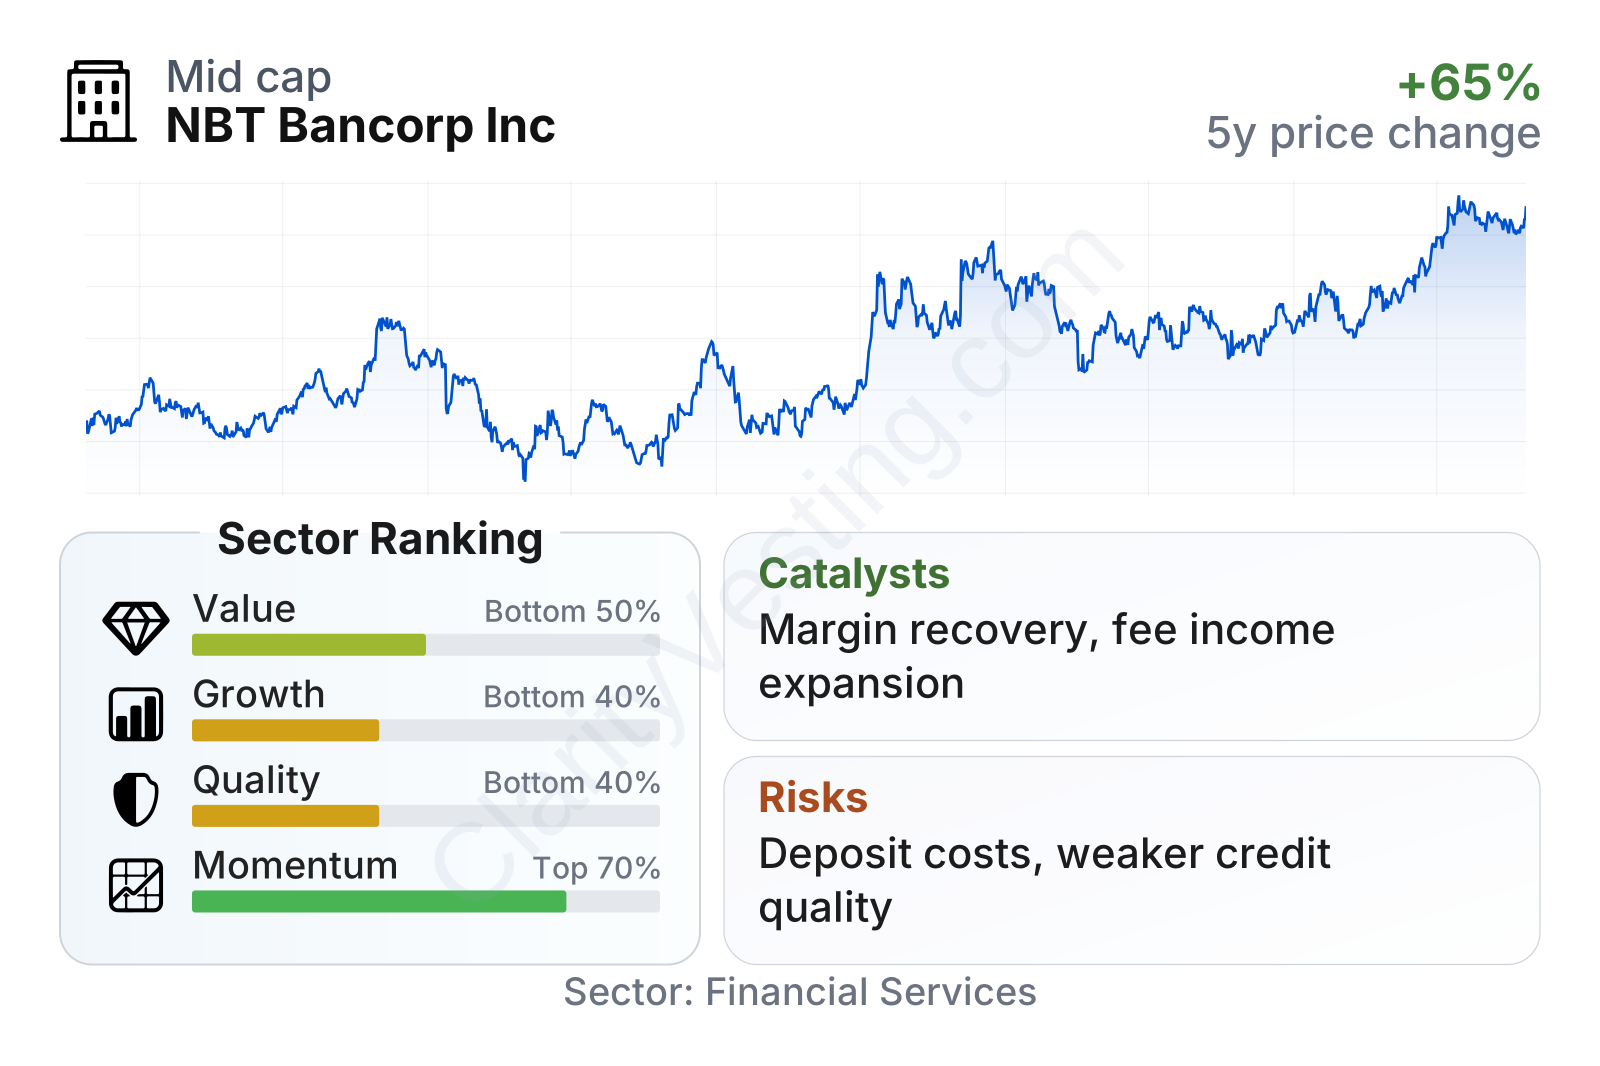
NBT Bancorp sits in the mid-cap range for regional banks and has shown relatively low share-price volatility, with a beta well below 1. On valuation, its earnings multiple is close to the sector median, while its price-to-book ratio is modestly above the median. Growth and quality scores are weaker than many peers, largely because earnings growth and returns on equity and assets have trailed the group, even though margins and balance-sheet leverage look comparatively solid. Momentum has recently improved, suggesting the market has become more constructive on the bank than it was during the pressure seen across regional banks in 2023.
Growth
Regional banking is not a high-growth sector in the way software or semiconductors can be, but it remains an essential part of the economy. The main long-term growth drivers are population and business activity in local markets, loan demand, branch and customer acquisition, wealth management expansion, and selective acquisitions. For NBT, this means growth tends to be incremental rather than explosive. That can still be attractive when combined with stable deposits, disciplined underwriting, and recurring fee income.
NBT’s strategy appears practical for that kind of environment. The bank has focused on traditional community banking, commercial lending, and fee-based businesses such as wealth management, retirement plan services, and insurance. That mix makes sense because it reduces dependence on a single revenue stream. It also gives the company more ways to deepen client relationships without needing to enter riskier or more specialized businesses.
Earnings per share show why NBT needs to be viewed with patience rather than through a short-term lens. Profitability weakened from 2021 through 2024 before improving again in 2025. That pattern reflects the industrywide shift from the unusually favorable post-pandemic period to a tougher environment marked by higher deposit costs and narrower spreads. The rebound is encouraging, but it also shows that NBT’s earnings power is cyclical and tied closely to interest-rate dynamics.
Book value per share has moved upward over time, especially after the dip seen earlier in the period. For a bank, this is an important sign because book value reflects the capital base that supports lending and absorb losses if credit conditions worsen. NBT’s book value trend suggests that, despite earnings volatility, the company has continued to build shareholder equity over the medium term.
A meaningful catalyst is the possibility of a more favorable deposit-cost environment. If competition for deposits eases or interest rates stabilize in a way that helps funding costs fall faster than asset yields, regional banks like NBT can see margin improvement. Another catalyst is continued growth in fee businesses, which are less balance-sheet intensive than lending and can support steadier revenue. The company has also remained active in market expansion and customer-facing services, which can gradually increase scale without changing the underlying character of the franchise.
Recent company reporting has also pointed to continued loan and deposit discipline rather than aggressive balance-sheet stretching. In the current environment, that restraint is not exciting, but it can be valuable. For a regional bank, avoiding avoidable mistakes during a difficult credit and funding cycle can be just as important as posting fast loan growth.
Risks
This article is for informational purposes only and does not constitute financial advice. Some content is AI-generated. See Disclaimer


