Stock Analysis · Nebius Group N.V (NBIS)
Overview
Nebius Group N.V. is building infrastructure for artificial intelligence. In simple terms, it provides the computing power, cloud platform, and related tools that companies need to train, run, and deploy AI models. The group was created out of the former international assets of Yandex and now presents itself as an AI-focused technology company with several operating units, including cloud and GPU infrastructure, data labeling, education technology, and autonomous driving technology.
For long-term analysis, the most important point is that Nebius is not a broad, mature internet platform today. It is an AI infrastructure company in an investment phase. That means current profits are not the core of the case; scale, demand, capacity expansion, and execution are more important right now.
Based on company disclosures, revenue is currently diversified across several activities, although AI infrastructure is the strategic centerpiece. Exact 2026 segment percentages are not fully standardized in the same way as large mature software groups, so the mix should be treated as approximate rather than precise. A practical breakdown is:
- Core AI infrastructure / cloud computing: the largest and fastest-growing activity, centered on GPU capacity, cloud services, and AI-native infrastructure for enterprise and developer workloads.
- Toloka: data solutions used to train and evaluate AI models, including human-in-the-loop annotation and testing services.
- TripleTen: education technology focused on digital and technical training programs.
- Avride and related autonomous technology: self-driving and robotics-related development, strategically important but still early relative to the rest of the business.
The broader financial path also shows a company that has been reshaped heavily over the last few years. Reported revenue fell sharply after the separation from the old Yandex structure, then began rebuilding from a much smaller base. By 2025, revenue recovered to roughly $530 million, versus about $118 million in 2024, while operating income briefly turned positive. That turnaround matters, but it should still be viewed as early-stage rebuilding rather than a settled earnings profile.
The cost structure reflects this repositioning. Gross profit improved sharply in 2025, but operating expenses remained high because the company is spending aggressively on research, infrastructure, and commercial buildout. In other words, Nebius is prioritizing growth capacity over near-term cash generation.
The business mix has changed dramatically since 2021. What stands out most is the jump in revenue and gross profit in 2025 after a reset period in 2022–2024, alongside still-heavy operating spending. That pattern is typical of a company trying to secure a place in a fast-expanding market before optimizing margins.
Key Figures
| Metric | Value | Sector ⓘ |
|---|---|---|
| Date | Oct 31, 2026 | |
| Context | ||
| Sector | Communication Services | |
| Industry | Internet Content & Information | |
| Market Cap ⓘ | $41.67B | |
| Beta ⓘ | 1.46 | |
Value (Cheapness) | ||
| P/E Ratio ⓘ | 123.60 | 18.47 |
| FCF Yield ⓘ | -14.12% | 14.23% |
| Dividend Yield ⓘ | N/A | 2.78% |
| EBIT / EV ⓘ | 0.33% | 4.73% |
| PEG ⓘ | 0.36 | |
Growth (Business expansion) | ||
| Revenue Growth ⓘ | 454.00% | 6.10% |
| RPS Growth (5Y CAGR) ⓘ | -36.83% | 4.57% |
| EPS Growth (5Y CAGR) ⓘ | -51.83% | -17.96% |
| Margin Growth (5Y Trend) ⓘ | N/A | 1.32% |
| FCF Growth (5Y CAGR) ⓘ | N/A | 5.75% |
| DPS Growth (5Y CAGR) ⓘ | N/A | 5.19% |
Quality (Business durability) | ||
| ROIC (Latest) ⓘ | 2.08% | 9.19% |
| ROIC (5Y Median) ⓘ | N/A | 8.24% |
| Net Debt / EBIT (Latest) ⓘ | 13.53 | 1.92 |
| Net Debt / EBIT (5Y Median) ⓘ | N/A | 2.88 |
| Net Debt / EBITDA (Latest) ⓘ | 2.17 | 1.22 |
| Net Debt / Assets ⓘ | 7.20% | 18.63% |
| EBITDA / Interest ⓘ | 4.39 | 8.36 |
| Operating Margin (Latest) ⓘ | 10.98% | 15.68% |
| Operating Margin (5Y Median) ⓘ | -335.32% | 13.39% |
| Debt to Equity (Latest) ⓘ | 97.26% | 59.65% |
| Profit Margin (Latest) ⓘ | 3.13% | 8.74% |
| Free Cash Flow (Latest) ⓘ | -$5.88B | |
Momentum (Price trend) | ||
| 3Y Return ⓘ | +800.05% | +46.16% |
| 12M Return (excl. last month) ⓘ | +120.36% | +1.26% |
| 6M Return ⓘ | +17.60% | 0.00% |
| Price vs. 200-Day MA ⓘ | -3.43% | +0.87% |
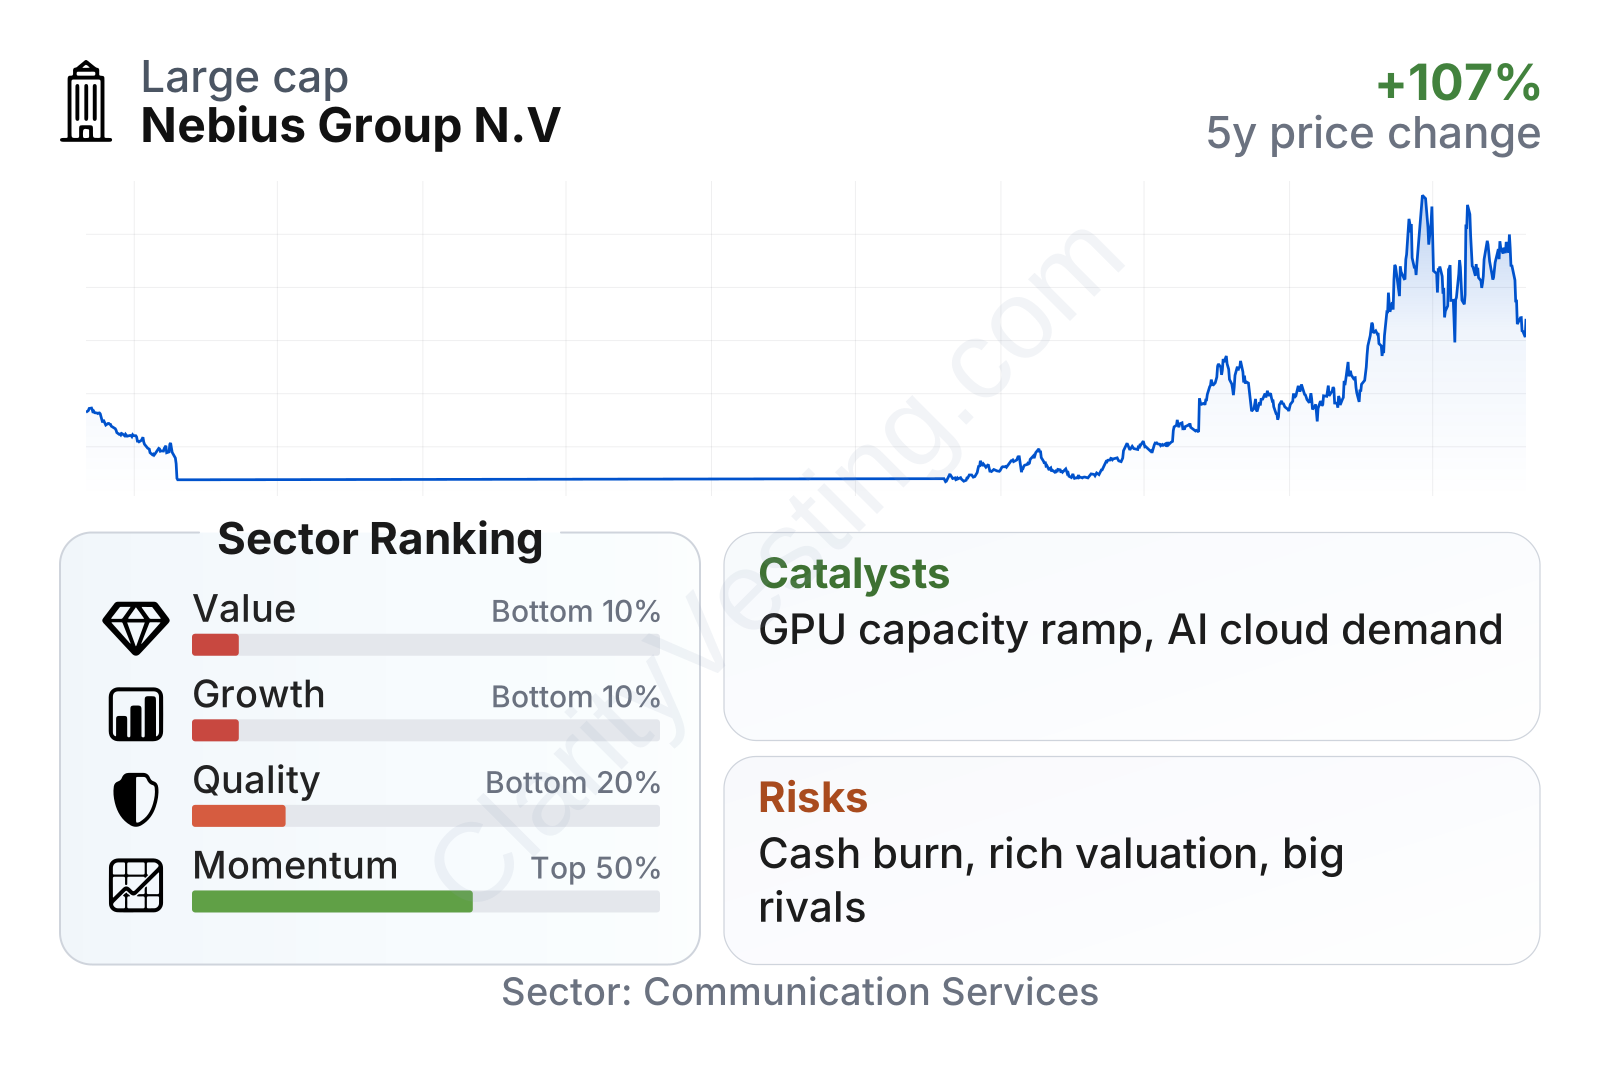
Nebius currently looks unusual across the main financial factors. Valuation metrics are weak compared with the sector, quality indicators are below average, and free cash flow is deeply negative. Growth is also distorted by the company’s restructuring history, which makes multi-year comparisons look poor despite a sharp recent rebound. The one area that clearly stands out is market momentum: the share price has surged far more than the sector, showing that the market is pricing in a much larger future business than the current income statement suggests.
The company is also now a large-cap name by market value, with above-average stock volatility. That combination usually signals a business where expectations have moved ahead of current fundamentals.
Growth
Nebius operates in one of the strongest growth areas in technology: AI infrastructure. Demand for GPU clusters, cloud capacity optimized for AI workloads, and tools for training and inference has expanded rapidly as more companies build AI products. This is an attractive market because demand is being driven by both startups and large enterprises, and because compute infrastructure can become a recurring revenue base once customers build their workflows on top of it.
The company’s strategy is coherent for that environment. Rather than trying to compete directly with the largest consumer AI platforms, Nebius is positioning itself as an enabler. That means offering specialized infrastructure to those building AI applications themselves. This is a sensible niche because the total addressable market is large, and customers often want alternatives to the biggest U.S. hyperscalers.
Recent growth has been very strong on a year-over-year basis, with multiple periods showing several hundred percent expansion from a small base. Even the latest growth rate remains far above the sector median. The important nuance is that this growth comes after a reset period, so the percentages are amplified by a low starting point. Still, the direction is clearly positive.
The tradeoff is visible in cash flow. Free cash flow remains deeply negative and has worsened as the company invests in infrastructure. That is not surprising for an AI capacity buildout, but it does mean the growth plan depends on continued access to capital and disciplined execution.
A notable catalyst is the simple supply-demand imbalance in AI computing. If Nebius can bring more GPU capacity online and keep utilization high, revenue can scale quickly because demand for quality AI infrastructure has been stronger than available supply in many parts of the market. Recent company communications have emphasized expansion of AI-native cloud operations and partnerships around compute deployment, which supports the idea that management is trying to capture this window while it is still open.
Another important growth driver is the ecosystem effect across its businesses. Toloka can support model development and evaluation, cloud infrastructure can host workloads, and autonomous technology creates internal and external AI use cases. These units are not equal in size, but together they make Nebius more than just a commodity server landlord.
Risks
This article is for informational purposes only and does not constitute financial advice. Some content is AI-generated. See Disclaimer


