Stock Analysis · National Australia Bank Ltd (NAUBF)
Overview
National Australia Bank Ltd is one of Australia’s largest banking groups. It provides everyday banking, home loans, business lending, institutional banking, deposits, payments, and wealth-related services. The group is especially well known for its strong position in business banking, where it serves small businesses, middle-market companies, larger corporates, and institutional clients. For U.S. readers seeing the NAUBF symbol, this is the over-the-counter line for the Australian-listed bank.
NAB’s revenue mainly comes from banking income rather than from manufacturing or retail activities. In simple terms, the bank earns money from the spread between what it charges on loans and what it pays on deposits and funding, plus fees from banking services. Based on recent annual reporting, the broad sources of revenue can be summarized as follows:
- Net interest income: approximately 75% to 85% of total operating income. This includes interest earned on mortgages, business loans, corporate lending, and other balance-sheet activities, minus interest paid on customer deposits and wholesale funding.
- Fee and commission income: approximately 10% to 20%. This includes transaction banking, card and payment fees, account-related fees, lending fees, and service charges.
- Treasury, markets, and other non-interest income: approximately 5% to 10%. This includes foreign exchange, risk management products, trading-related income, and assorted other banking income lines.
By business mix, NAB is heavily exposed to Australia and New Zealand, with the largest earnings contribution typically coming from Business & Private Banking, followed by Personal Banking, Corporate & Institutional Banking, and then Bank of New Zealand. That concentration matters because it gives the group scale in a relatively stable banking market, but it also ties results closely to the economic health of Australia and New Zealand.
The longer-term direction of the income base looks fairly steady: revenue has generally risen over the last several years, while profitability has remained solid even as funding costs and competition moved around. Net income has stayed in the multi-billion-dollar range, showing the resilience typical of a large incumbent bank.
The business has expanded revenue meaningfully since 2021, while net income has remained solid rather than accelerating at the same pace. That suggests top-line growth has been partly offset by higher funding costs, operating expenses, and credit-normalization pressures, which is common for banks after a period of unusually favorable margins.
Key Figures
| Metric | Value | Sector ⓘ |
|---|---|---|
| Date | Oct 03, 2026 | |
| Context | ||
| Sector | Financial Services | |
| Industry | Banks - Diversified | |
| Market Cap ⓘ | $82.66B | |
| Beta ⓘ | 0.71 | |
Value (Cheapness) | ||
| P/E Ratio ⓘ | 19.29 | 12.60 |
| P/B Ratio ⓘ | 0.96 | 1.23 |
| FCF Yield ⓘ | -53.45% | 10.16% |
| Dividend Yield ⓘ | 12.59% | 2.96% |
| EBIT / EV ⓘ | 12.77% | 7.77% |
| PEG ⓘ | N/A | |
Growth (Business expansion) | ||
| Revenue Growth ⓘ | 6.10% | 9.50% |
| RPS Growth (5Y CAGR) ⓘ | 57.64% | 12.10% |
| EPS Growth (5Y CAGR) ⓘ | 0.89% | -9.45% |
| BVPS Growth (5Y CAGR) ⓘ | 14.42% | 5.01% |
| Margin Growth (5Y Trend) ⓘ | -37.68% | -4.07% |
| FCF Growth (5Y CAGR) ⓘ | N/A | 4.96% |
| DPS Growth (5Y CAGR) ⓘ | 32.46% | 8.79% |
Quality (Business durability) | ||
| ROIC (Latest) ⓘ | N/A | 9.60% |
| ROE (Latest) ⓘ | 21.38% | 13.84% |
| ROA (Latest) ⓘ | 1.17% | 1.53% |
| ROIC (5Y Median) ⓘ | 2.87% | 7.86% |
| ROE (5Y Median) ⓘ | 11.31% | 12.20% |
| ROA (5Y Median) ⓘ | 0.70% | 1.29% |
| Net Debt / EBIT (Latest) ⓘ | N/A | 0.91 |
| Net Debt / EBIT (5Y Median) ⓘ | 11.03 | 0.74 |
| Net Debt / EBITDA (Latest) ⓘ | N/A | 0.97 |
| Operating Margin (Latest) ⓘ | 40.25% | 22.12% |
| Operating Margin (5Y Median) ⓘ | 52.32% | 24.39% |
| Debt to Equity (Latest) ⓘ | 313.74% | 60.37% |
| Profit Margin (Latest) ⓘ | 29.26% | 26.62% |
| Free Cash Flow (Latest) ⓘ | -$44.18B | |
Momentum (Price trend) | ||
| 3Y Return ⓘ | +85.22% | +89.23% |
| 12M Return (excl. last month) ⓘ | +13.82% | +17.35% |
| 6M Return ⓘ | -15.99% | +10.00% |
| Price vs. 200-Day MA ⓘ | +6.53% | +3.73% |
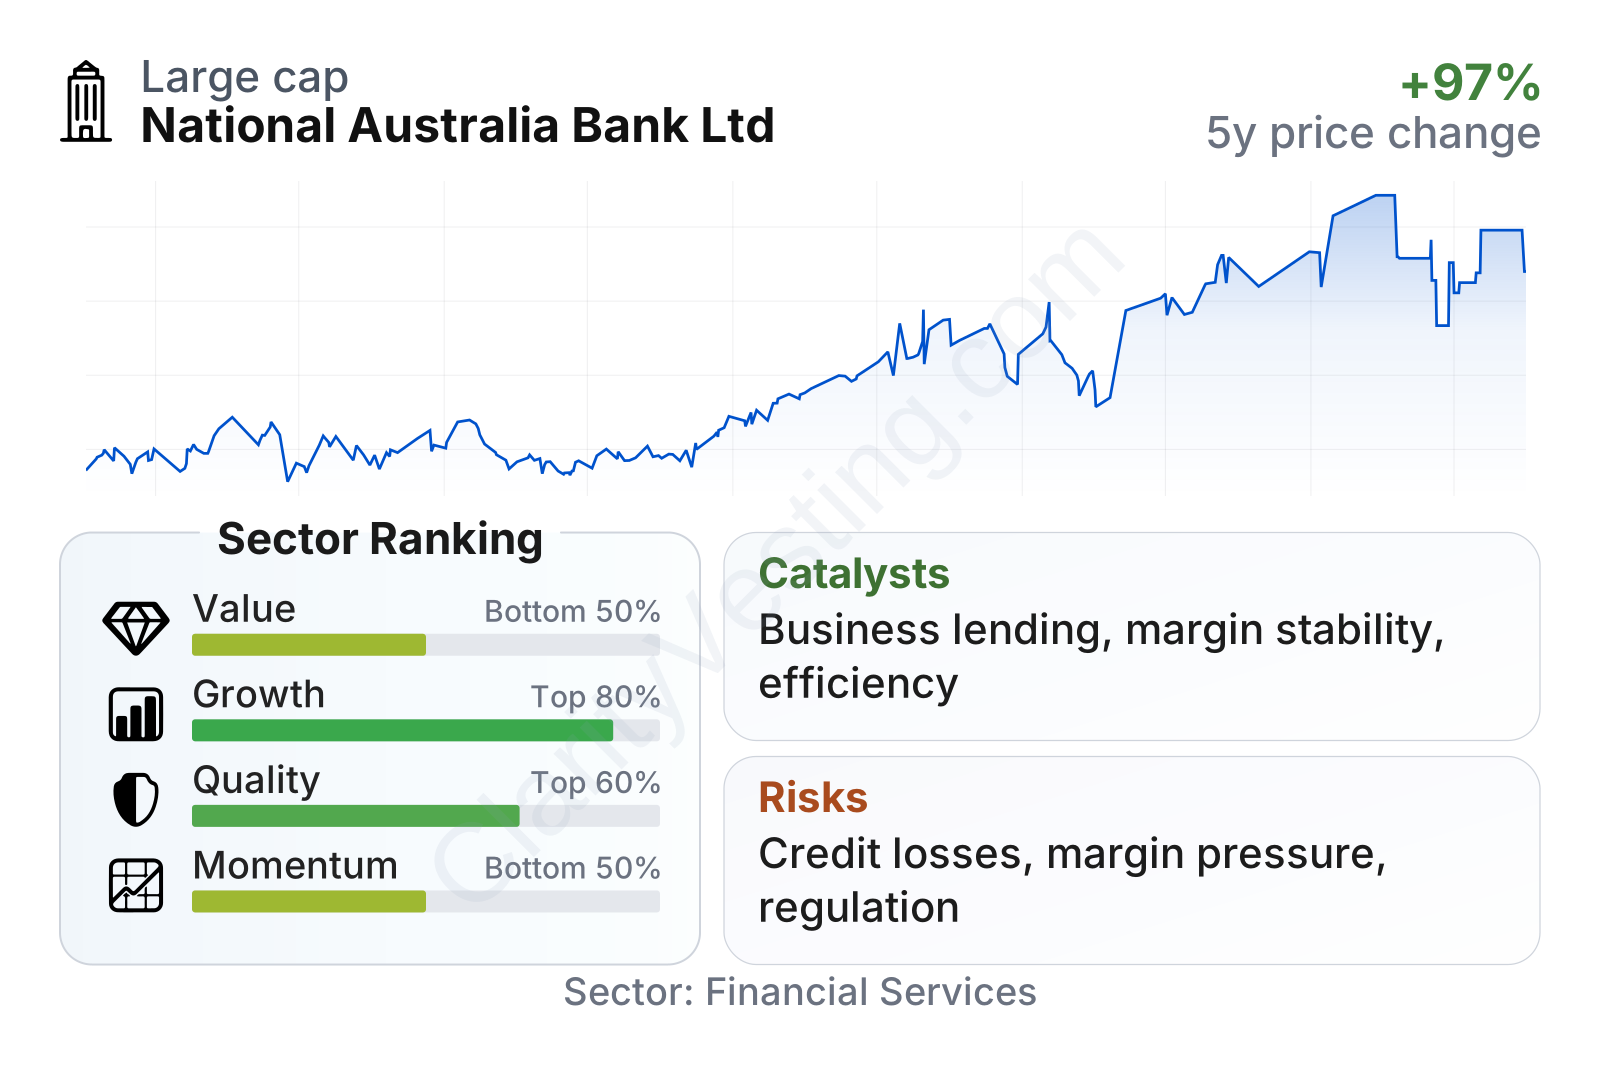
NAB stands out as a very large bank with relatively low share-price volatility, as reflected by its beta below 1. On the factor view, growth and quality look better than pure value. Profitability metrics are solid, especially return on equity and operating margin, while valuation is mixed: the earnings multiple sits above the sector median, but the price-to-book ratio remains below the sector median. The negative free cash flow reading is not unusual to treat carefully for banks, because cash flow measures can be distorted by balance-sheet movements and do not always reflect earning power as clearly as they do for industrial companies.
The stock’s longer-term price trend has been constructive, with the share price more than doubling from late 2021 to September 2026. That does not prove fundamentals will keep improving, but it does show that the market has become more willing to pay for NAB’s earnings durability and capital strength over time.
Growth
Banking is not a high-growth industry in the way software or biotech can be, but it is a structurally important sector with durable demand. Households need deposits, mortgages, and payments. Businesses need working capital, equipment finance, transaction banking, and treasury services. In Australia, that demand base is supported by population growth, high banking penetration, and a market structure dominated by a few large institutions. That usually creates moderate but persistent growth rather than explosive expansion.
NAB’s strategy is sensible for that kind of environment. The bank has leaned into business banking, where customer relationships can be deeper and less commoditized than in pure consumer lending. It has also continued investing in digital capabilities, simplification, and productivity, which matters because banking increasingly depends on keeping customers engaged through mobile channels while controlling costs. For a mature bank, growth is often a combination of loan volume, deposit growth, pricing discipline, and operational efficiency rather than dramatic market creation.
Earnings per share have recently pulled back from the prior year, which suggests growth is not moving in a straight line. For a bank, that is not unusual: earnings can fluctuate with credit provisions, margin pressure, and competitive repricing. The more important point for long-term analysis is whether profits remain solid through the cycle, and NAB still appears to be generating substantial earnings even after this decline.
Book value per share has improved strongly over the last five years, including a sharp step-up in the latest period. For banks, book value is a particularly useful anchor because it reflects the capital base supporting future lending and earnings. A rising book value usually signals retained profits, resilient balance-sheet management, or capital actions that strengthen shareholder equity over time.
Potential catalysts are mostly tied to execution and the operating backdrop rather than to one single breakthrough event. If interest margins stabilize, if business lending continues to outgrow the system, and if cost control improves, NAB could support further earnings resilience. Another positive driver is capital discipline: large Australian banks are often judged not only on growth, but also on how consistently they turn profits into capital strength and distributions.
Recent company updates have continued to emphasize productivity initiatives, technology investment, customer simplification, and support for core business-banking franchises. None of these are dramatic headline events, but together they point to an effort to defend margins and improve efficiency in a market where scale is a major advantage.
Risks
This article is for informational purposes only and does not constitute financial advice. Some content is AI-generated. See Disclaimer


