Stock Analysis · MYR Group Inc (MYRG)
Overview
MYR Group Inc. is a specialty contractor focused on electric infrastructure. In simple terms, it helps build, upgrade, and maintain the systems that move electricity from power plants and renewable projects to homes, businesses, factories, and data centers. The company operates through a network of subsidiaries across the United States and Canada and works on projects such as transmission lines, substations, distribution networks, commercial electrical systems, and industrial installations.
Its business is organized into two main operating segments. Based on the latest annual mix, revenue is roughly split as follows:
- Transmission & Distribution (T&D): about 56% of revenue. This includes high-voltage transmission lines, substations, distribution systems, grid hardening, storm restoration, and utility-scale work tied to renewable interconnections.
- Commercial & Industrial (C&I): about 44% of revenue. This includes electrical construction services for data centers, transportation, manufacturing, healthcare, water facilities, and other non-residential projects.
The business model is straightforward but operationally demanding: MYR wins contracts, manages labor and equipment, buys materials, executes projects on time, and earns a profit if it controls costs well. That makes the company closely tied to broader infrastructure spending, utility capital programs, and the pace of large construction projects.
Over the last several years, revenue has grown meaningfully, but profitability has been more uneven. The flow from sales to profit shows a contractor with large project volume, high direct costs, and relatively thin margins, which is typical for this industry. The most notable recent improvement is that earnings and cash generation recovered strongly after a weak 2024.
The long-term pattern shows that sales expanded from roughly $2.5 billion in 2021 to about $3.7 billion in 2025, while net income dipped sharply in 2024 before rebounding in 2025. That highlights both the scale opportunity in power infrastructure and the sensitivity of results to project execution.
Key Figures
| Metric | Value | Sector ⓘ |
|---|---|---|
| Date | Oct 24, 2026 | |
| Context | ||
| Sector | Industrials | |
| Industry | Engineering & Construction | |
| Market Cap ⓘ | $4.28B | |
| Beta ⓘ | 1.32 | |
Value (Cheapness) | ||
| P/E Ratio ⓘ | 26.10 | 22.29 |
| P/B Ratio ⓘ | 5.73 | 1.98 |
| FCF Yield ⓘ | 4.52% | 6.26% |
| Dividend Yield ⓘ | N/A | 1.92% |
| EBIT / EV ⓘ | 4.98% | 4.83% |
| PEG ⓘ | 3.41 | |
Growth (Business expansion) | ||
| Revenue Growth ⓘ | 20.10% | 9.30% |
| RPS Growth (5Y CAGR) ⓘ | 12.42% | 7.76% |
| EPS Growth (5Y CAGR) ⓘ | 6.24% | -13.17% |
| BVPS Growth (5Y CAGR) ⓘ | 8.54% | 6.13% |
| Margin Growth (5Y Trend) ⓘ | -0.16% | 0.74% |
| FCF Growth (5Y CAGR) ⓘ | 28.61% | 10.79% |
| DPS Growth (5Y CAGR) ⓘ | N/A | 9.41% |
Quality (Business durability) | ||
| ROIC (Latest) ⓘ | 23.22% | 10.75% |
| ROA (Latest) ⓘ | 9.96% | 5.41% |
| ROIC (5Y Median) ⓘ | 15.29% | 9.37% |
| ROA (5Y Median) ⓘ | 6.62% | 4.95% |
| Net Debt / EBIT (Latest) ⓘ | -0.31 | 2.04 |
| Net Debt / EBIT (5Y Median) ⓘ | 0.20 | 2.27 |
| Net Debt / EBITDA (Latest) ⓘ | -0.24 | 1.39 |
| Net Debt / Assets ⓘ | -4.23% | 19.27% |
| EBITDA / Interest ⓘ | 58.85 | 9.58 |
| Operating Margin (Latest) ⓘ | 5.62% | 10.49% |
| Operating Margin (5Y Median) ⓘ | 3.91% | 10.30% |
| Debt to Equity (Latest) ⓘ | 8.89% | 64.82% |
| Profit Margin (Latest) ⓘ | 4.13% | 6.67% |
| Free Cash Flow (Latest) ⓘ | $193.36M | |
Momentum (Price trend) | ||
| 3Y Return ⓘ | +116.72% | +67.77% |
| 12M Return (excl. last month) ⓘ | +61.28% | +12.05% |
| 6M Return ⓘ | -17.69% | 0.00% |
| Price vs. 200-Day MA ⓘ | -17.64% | +0.67% |
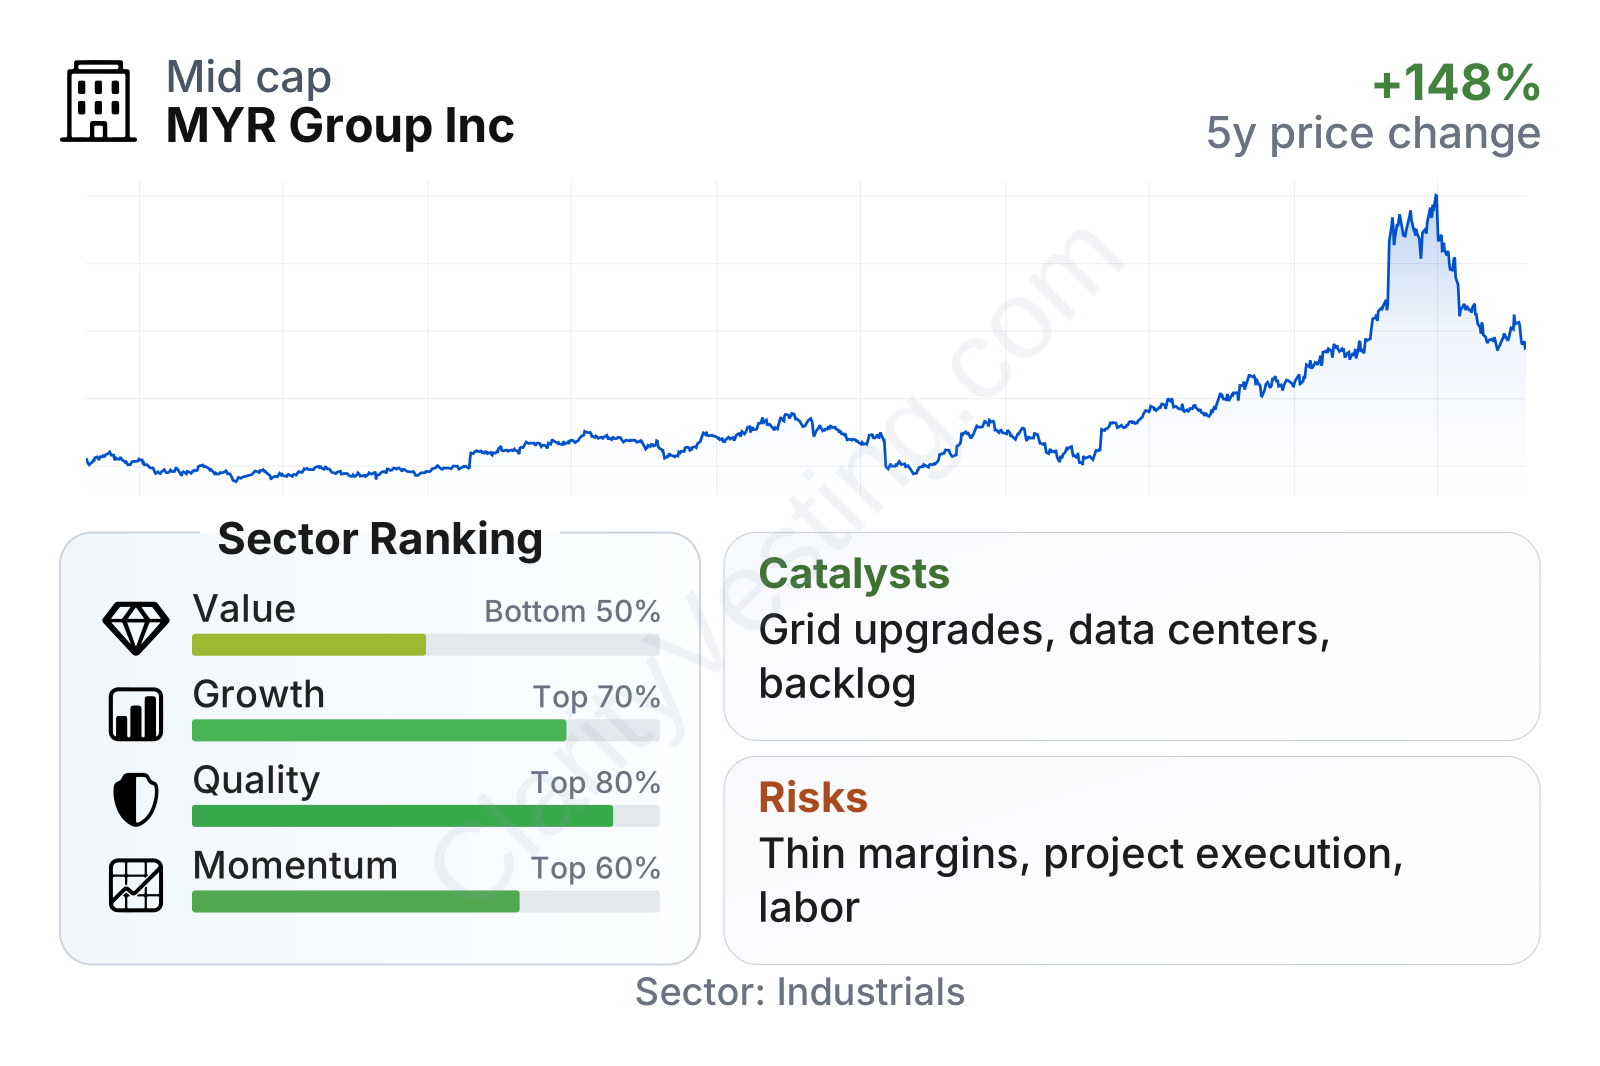
MYR Group is a mid-sized industrial company with a stock that has been volatile but very strong over the last few years. Momentum has clearly outpaced much of the sector over multi-year and recent trailing periods. Growth and quality metrics also compare well with peers, especially returns on capital and balance-sheet strength.
The weaker area is valuation. The shares trade above the sector median on earnings and far above it on book value, while free cash flow yield is lower than the sector median. Profitability is also mixed: returns on capital are strong, but operating and net margins remain below many peers, reminding readers that this is still a project-based contractor where execution matters a great deal.
Growth
MYR Group operates in a part of the market that appears structurally supported for years, not just quarters. North American electric grids need modernization, utilities are spending on reliability and resilience, renewable generation requires new transmission connections, and electricity demand is rising from data centers, manufacturing reshoring, and electrification trends. All of that can translate into more work for companies able to design and build complex electrical infrastructure.
The company’s strategy fits that backdrop reasonably well. It is positioned on both sides of the market: utility-focused transmission and distribution work, and commercial and industrial electrical construction. That diversification matters because it reduces dependence on a single project type or customer base. It also gives MYR exposure to several spending waves at once, from utility capex to large private-sector construction.
Revenue growth has been lumpy, which is normal for project-driven businesses, but the broader trend has remained favorable. After a clear slowdown and contraction in 2024, growth turned positive again in 2025 and has accelerated to around 20% year over year in recent periods, well above the sector median. That suggests project demand has remained healthy and that the company has regained execution momentum.
Cash generation has improved even more sharply than revenue. Free cash flow moved from negative territory during the difficult 2024 period to a much stronger level by 2026, reaching more than $200 million on a trailing basis. For a contractor, this is important because cash can swing with billing timing, working capital, and project mix. A rebound here often signals healthier project execution and better conversion of revenue into usable cash.
Recent company updates have also pointed to a solid backlog and ongoing opportunities tied to grid investment, renewable interconnections, transportation electrification, and data-center-related electrical work. Those are meaningful demand drivers because they tend to involve large, technically complex projects where qualified contractors are limited. In that environment, a company with scale, customer relationships, and specialized crews can capture growth without needing to invent a new product category.
Risks
This article is for informational purposes only and does not constitute financial advice. Some content is AI-generated. See Disclaimer


