Stock Analysis · Orbia Advance Corp (MXCHY)
Overview
Orbia Advance Corporation is a Mexican industrial group with global operations focused on products and services tied to everyday infrastructure. Its businesses are organized around building and infrastructure materials, precision agriculture, connectivity solutions, fluorinated products, and polymer solutions. In simple terms, Orbia sells pipes and building systems, irrigation equipment, telecom conduit and cable-related products, specialty fluorine and refrigerant products, and PVC-based compounds and resins used in many industrial applications.
The company’s revenue is diversified across five business groups. Based on recent annual reporting, the largest sources of revenue are approximately:
- Building & Infrastructure: about 35% of revenue. This includes pipes, fittings, water management, and construction-related systems sold under Wavin and related brands.
- Polymer Solutions: about 25% of revenue. This business includes PVC resins, compounds, and other materials used in construction, packaging, medical, and industrial applications.
- Precision Agriculture: about 17% of revenue. This is mainly micro-irrigation systems and related technology sold through Netafim.
- Connectivity Solutions: about 14% of revenue. This segment supplies conduit, ducting, and infrastructure products used in fiber and telecommunications deployment.
- Fluor & Energy Materials: about 9% of revenue. This includes fluorinated chemicals, refrigerants, and materials tied to industrial and energy uses.
That mix matters because Orbia is not a single-product company. Its results depend on several end markets at once: construction activity, crop economics, telecom network investment, industrial demand, and fluorochemical pricing. The benefit is diversification. The drawback is that weak conditions in several of those markets at the same time can weigh heavily on profitability.
The long-term direction in the income profile is mixed. Revenue peaked above $9.5 billion in 2022, then fell materially through 2024 before stabilizing and slightly improving in 2025. At the same time, operating income and net income compressed much more sharply than sales, showing that Orbia’s recent challenge has not only been lower demand in some businesses, but also weaker margins and heavier interest costs.
Key Figures
| Metric | Value | Sector ⓘ |
|---|---|---|
| Date | Oct 17, 2026 | |
| Context | ||
| Sector | Industrials | |
| Industry | Conglomerates | |
| Market Cap ⓘ | $2.34B | |
| Beta ⓘ | 0.70 | |
Value (Cheapness) | ||
| P/E Ratio ⓘ | N/A | 22.10 |
| P/B Ratio ⓘ | 0.71 | 1.97 |
| FCF Yield ⓘ | 12.25% | 6.38% |
| Dividend Yield ⓘ | N/A | 1.94% |
| EBIT / EV ⓘ | 8.00% | 4.79% |
| PEG ⓘ | N/A | |
Growth (Business expansion) | ||
| Revenue Growth ⓘ | 19.60% | 9.30% |
| RPS Growth (5Y CAGR) ⓘ | 16.17% | 7.81% |
| EPS Growth (5Y CAGR) ⓘ | N/A | -13.06% |
| BVPS Growth (5Y CAGR) ⓘ | 5.58% | 6.14% |
| Margin Growth (5Y Trend) ⓘ | -10.78% | 0.88% |
| FCF Growth (5Y CAGR) ⓘ | -37.21% | 11.01% |
| DPS Growth (5Y CAGR) ⓘ | 9.13% | 9.48% |
Quality (Business durability) | ||
| ROIC (Latest) ⓘ | N/A | 10.84% |
| ROA (Latest) ⓘ | -2.63% | 5.41% |
| ROIC (5Y Median) ⓘ | 11.67% | 9.38% |
| ROA (5Y Median) ⓘ | 1.28% | 4.95% |
| Net Debt / EBIT (Latest) ⓘ | 8.71 | 2.08 |
| Net Debt / EBIT (5Y Median) ⓘ | 4.92 | 2.27 |
| Net Debt / EBITDA (Latest) ⓘ | 4.04 | 1.39 |
| Net Debt / Assets ⓘ | 43.11% | 19.28% |
| EBITDA / Interest ⓘ | 2.49 | 9.58 |
| Operating Margin (Latest) ⓘ | 6.96% | 10.50% |
| Operating Margin (5Y Median) ⓘ | 10.65% | 10.29% |
| Debt to Equity (Latest) ⓘ | 267.63% | 65.48% |
| Profit Margin (Latest) ⓘ | -3.68% | 6.67% |
| Free Cash Flow (Latest) ⓘ | $286.83M | |
Momentum (Price trend) | ||
| 3Y Return ⓘ | -34.74% | +61.68% |
| 12M Return (excl. last month) ⓘ | +34.27% | +12.58% |
| 6M Return ⓘ | -1.42% | 0.00% |
| Price vs. 200-Day MA ⓘ | +3.08% | +0.02% |
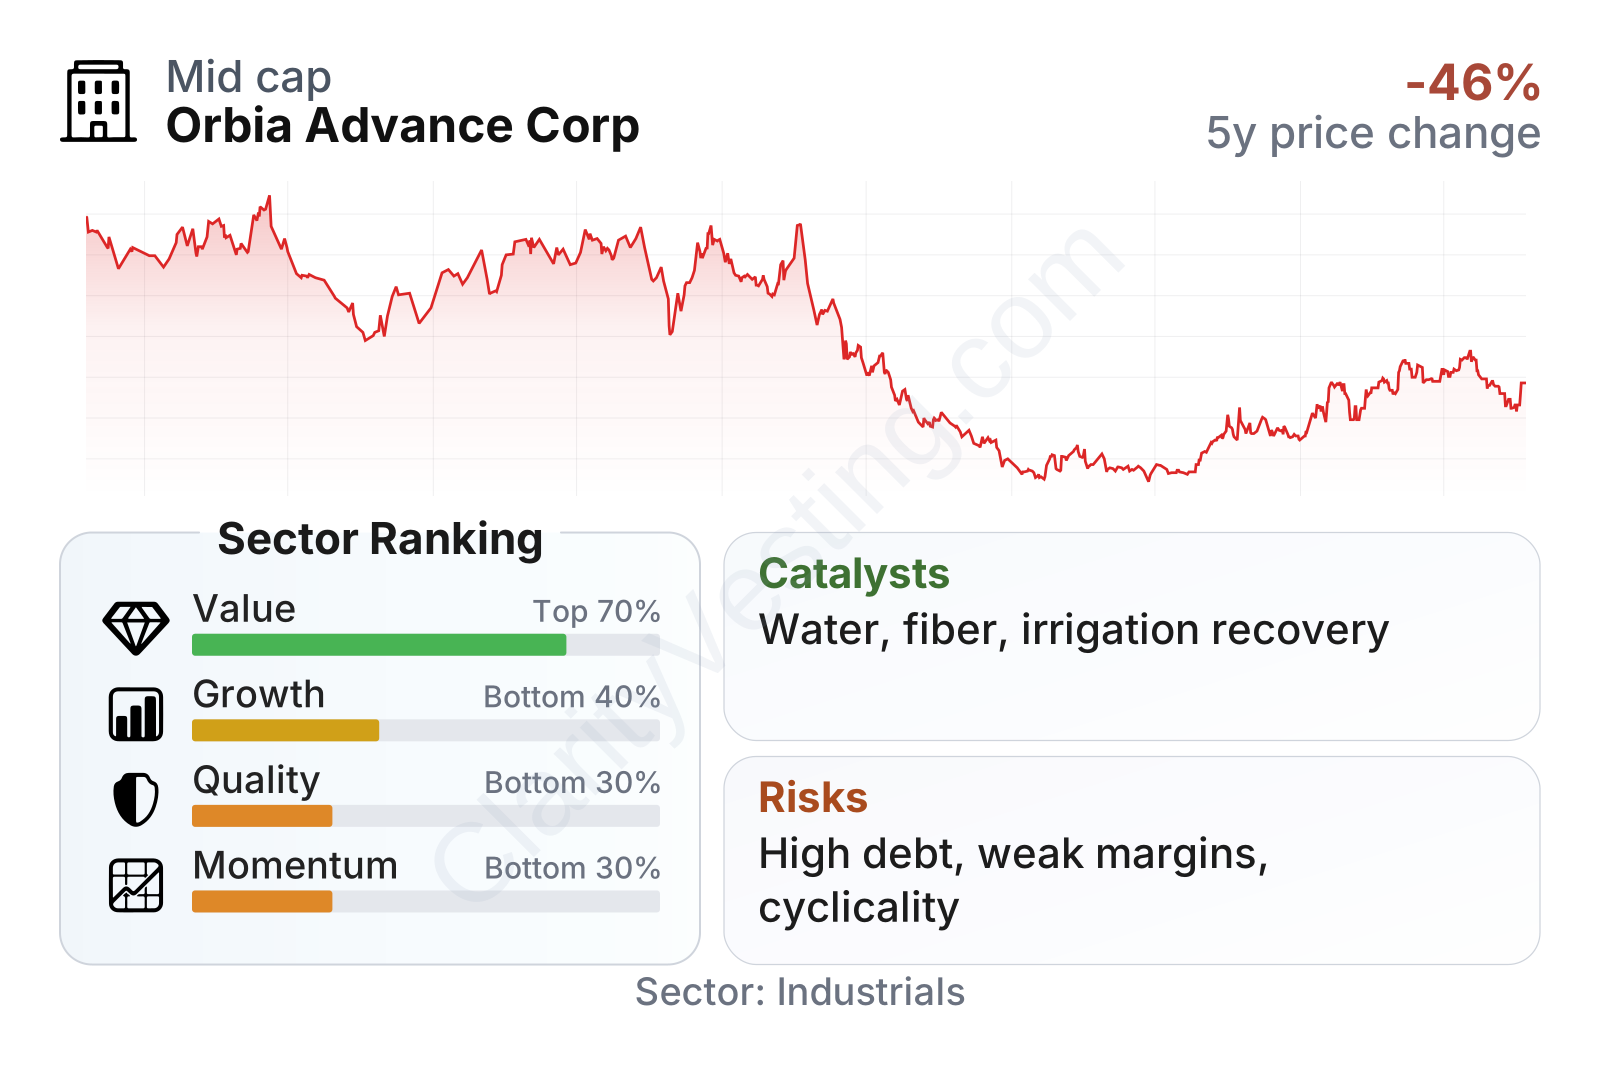
Orbia is a mid-sized industrial company with a relatively low beta, meaning its share price has historically moved less than the broader market. On valuation metrics, it screens cheaply versus much of the sector: price-to-book is well below the sector median, free cash flow yield is notably higher, and EBIT relative to enterprise value is also stronger than average. The more difficult part is business quality. Profitability, returns on assets, and leverage all look weaker than the sector, which explains why the stock trades at subdued multiples despite the low price-based ratios.
The stock chart also reflects that tension. Over the last several years, the shares have experienced a deep decline followed by a partial rebound in 2025 and 2026. That pattern usually signals that the market sees recovery potential, but still wants proof that earnings and balance-sheet pressure are improving in a durable way.
Growth
Orbia operates in several areas with long-term structural demand. Water infrastructure and water efficiency remain attractive themes as cities modernize networks and agriculture seeks higher yields with lower water usage. Telecom connectivity is another multi-year driver because fiber deployment still requires ducts and conduit. Building materials demand is more cyclical, but replacement of aging infrastructure can support activity over time. Fluorinated products and energy materials also offer niche growth potential, especially where tighter environmental standards or advanced manufacturing needs reshape demand.
The company’s strategy is logically aligned with those themes. Its portfolio is concentrated in products that solve practical problems: moving water, improving irrigation, enabling digital connections, and supplying specialty materials. This is easier to understand than a highly speculative growth plan. The main issue is timing. End markets such as construction, agriculture, and chemicals can go through long down cycles, and Orbia has been navigating exactly that kind of environment.
Recent revenue trends suggest conditions are improving after a prolonged contraction. Year-over-year sales growth was negative for most of 2023 and much of 2024, then turned positive and accelerated into 2026, with the latest reading around 20%, ahead of the sector median. That does not automatically mean a full recovery is in place, but it does indicate that the business may be moving beyond the trough in some of its markets.
Cash generation tells a more cautious story. Free cash flow remains positive, which is important, but the trailing twelve-month trend has declined significantly from the unusually strong levels seen a few years ago. In other words, Orbia is still producing cash, yet it is doing so with less cushion than before. For a company carrying meaningful debt, that makes improvement in margins and disciplined capital allocation especially important.
A meaningful catalyst is the possibility of margin recovery if volumes improve in construction-related products, irrigation demand normalizes, and pricing pressure eases in chemicals and polymers. Another useful support is Orbia’s exposure to infrastructure-linked spending rather than purely discretionary consumer demand. If management can convert the recent sales improvement into stronger operating profit, the earnings profile could look very different from the depressed recent baseline.
Risks
This article is for informational purposes only and does not constitute financial advice. Some content is AI-generated. See Disclaimer


