Stock Analysis · SOLV Energy Inc (MWH)
Overview
SOLV Energy Inc is a U.S. renewable energy services company focused on building and operating utility-scale solar projects, battery energy storage systems, and related high-voltage infrastructure. The company works mainly as an engineering, procurement, and construction contractor, and it also provides long-term operations and maintenance services once projects are running. Its customers are typically large project developers, independent power producers, and utilities.
The business is tied to the buildout of large renewable energy assets rather than the sale of electricity. That matters because SOLV Energy is closer to an infrastructure contractor and service provider than to a traditional regulated utility. Revenue tends to move with project awards, construction timing, and the size of its contracted backlog.
Based on company filings, the main revenue streams are:
- Construction and installation services: approximately 85% to 95% of revenue in recent years. This includes utility-scale solar plants, battery storage projects, and balance-of-system work such as civil, electrical, and high-voltage installation.
- Operations and maintenance services: approximately 5% to 15% of revenue. This includes plant monitoring, preventive maintenance, repairs, vegetation management, and other recurring support for operating renewable projects.
The broad financial pattern over the last several years shows an important shift: revenue was somewhat uneven, but profitability improved sharply from losses in 2022 and 2023 to positive operating income and net income in 2024, followed by a much stronger result in 2025. Gross profit also expanded materially, suggesting better project execution and pricing discipline than in the earlier period.
The business mix still leans heavily toward lower-margin construction work, but the earnings profile improved significantly by 2025 as revenue rebounded and operating profit scaled faster than sales. That combination is important for a company in a project-based industry where execution quality often matters more than simple revenue growth.
Key Figures
| Metric | Value | Sector ⓘ |
|---|---|---|
| Date | Oct 17, 2026 | |
| Context | ||
| Sector | Utilities | |
| Industry | Utilities - Renewable | |
| Market Cap ⓘ | $5.21B | |
| Beta ⓘ | N/A | |
Value (Cheapness) | ||
| P/E Ratio ⓘ | 54.74 | 17.28 |
| P/B Ratio ⓘ | 34.54 | 1.51 |
| FCF Yield ⓘ | 5.61% | 0.65% |
| Dividend Yield ⓘ | N/A | 3.77% |
| EBIT / EV ⓘ | 3.94% | 5.01% |
| PEG ⓘ | N/A | |
Growth (Business expansion) | ||
| Revenue Growth ⓘ | 77.50% | 6.10% |
| RPS Growth (5Y CAGR) ⓘ | 1.90% | 3.87% |
| EPS Growth (5Y CAGR) ⓘ | N/A | -11.30% |
| BVPS Growth (5Y CAGR) ⓘ | 6.72% | 4.23% |
| Margin Growth (5Y Trend) ⓘ | 11.39% | 3.57% |
| FCF Growth (5Y CAGR) ⓘ | 76.22% | -8.84% |
| DPS Growth (5Y CAGR) ⓘ | N/A | 4.84% |
Quality (Business durability) | ||
| ROIC (Latest) ⓘ | 29.44% | 6.53% |
| ROA (Latest) ⓘ | 4.46% | 3.20% |
| ROIC (5Y Median) ⓘ | N/A | 5.95% |
| ROA (5Y Median) ⓘ | N/A | 2.75% |
| Net Debt / EBIT (Latest) ⓘ | -1.46 | 7.13 |
| Net Debt / EBIT (5Y Median) ⓘ | N/A | 7.23 |
| Net Debt / EBITDA (Latest) ⓘ | -0.97 | 4.31 |
| Net Debt / Assets ⓘ | -13.16% | 38.42% |
| EBITDA / Interest ⓘ | 6.72 | 4.58 |
| Operating Margin (Latest) ⓘ | 6.05% | 20.83% |
| Operating Margin (5Y Median) ⓘ | 0.60% | 20.08% |
| Debt to Equity (Latest) ⓘ | 16.83% | 137.69% |
| Profit Margin (Latest) ⓘ | 3.76% | 11.37% |
| Free Cash Flow (Latest) ⓘ | $291.99M | |
Momentum (Price trend) | ||
| 3Y Return ⓘ | N/A | +52.37% |
| 12M Return (excl. last month) ⓘ | N/A | +8.84% |
| 6M Return ⓘ | -28.47% | -3.95% |
| Price vs. 200-Day MA ⓘ | N/A | -0.79% |
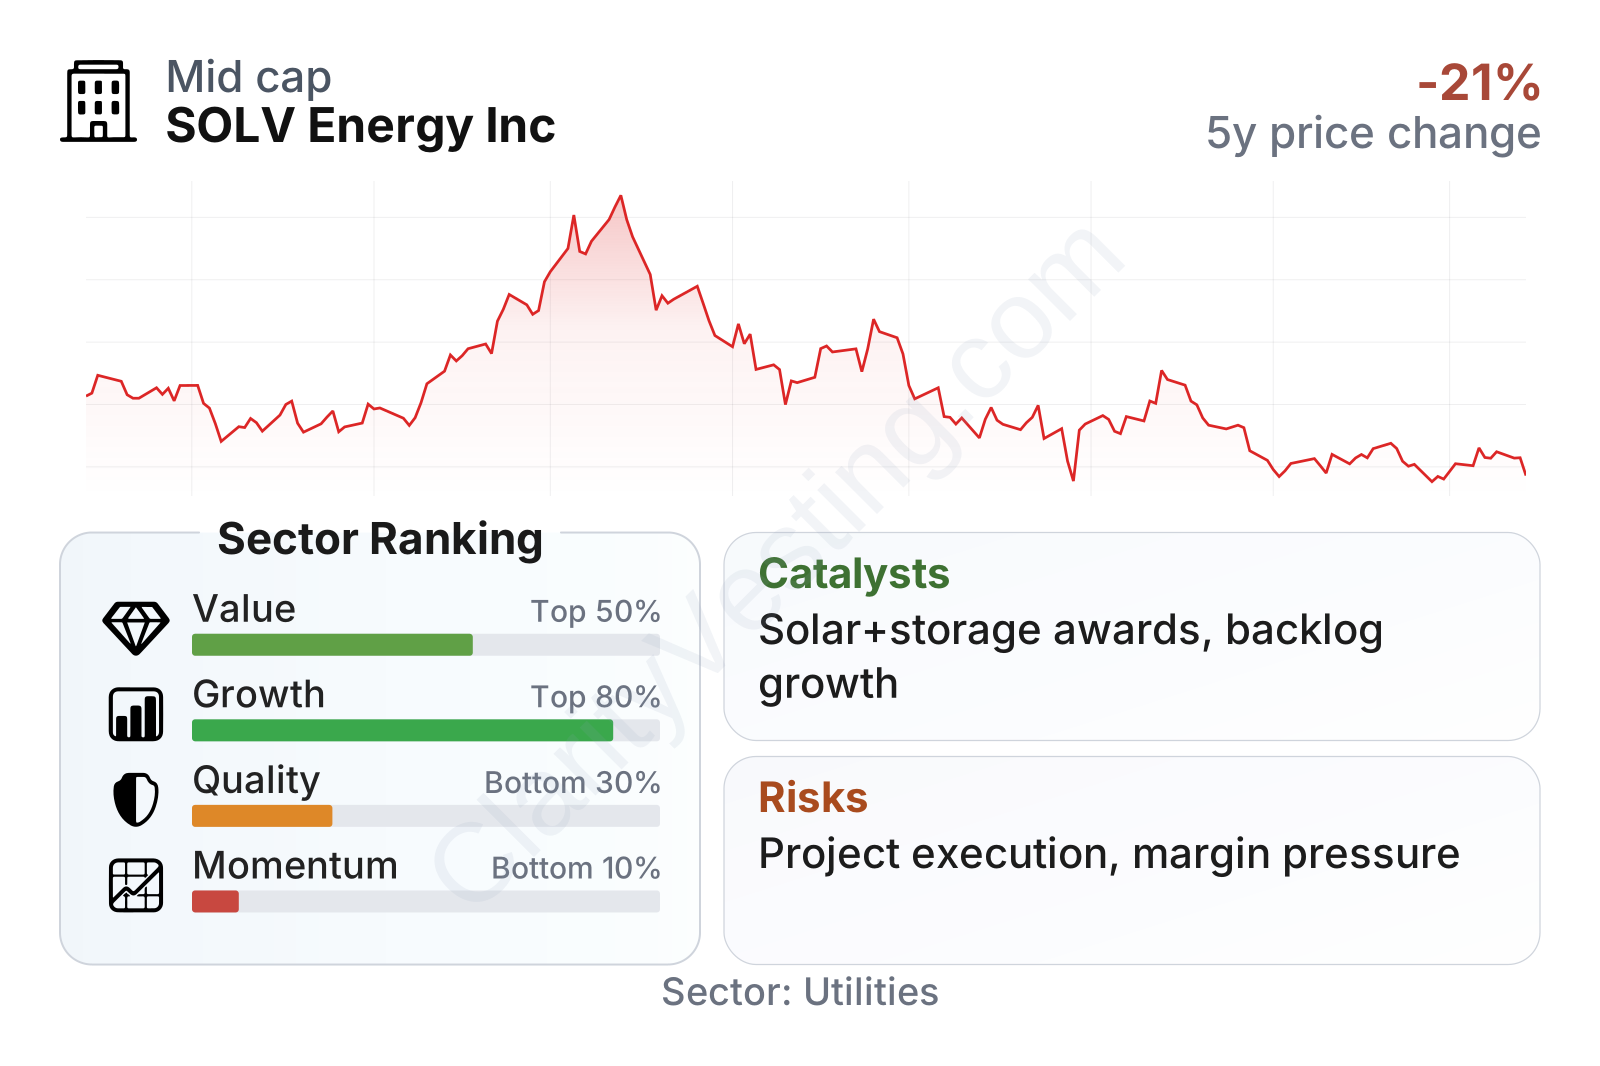
SOLV Energy sits in the upper tier of its sector on growth, but the picture is mixed elsewhere. Revenue growth has been exceptionally strong recently, free cash flow is solid, and leverage is low compared with most utilities. At the same time, the stock trades at clearly higher earnings and book-value multiples than the sector median, while profitability margins remain below typical utility levels. Share price momentum has also been weak in recent months, which suggests the market has become more cautious after a strong earlier move.
The company is now a mid-sized listed renewable infrastructure name rather than a small speculative newcomer. Its financial profile looks less balance-sheet-heavy than many utility peers, with net cash-like leverage metrics and interest coverage that appears healthier than the sector median.
Growth
SOLV Energy operates in a part of the market that still has strong long-term support. Utility-scale solar and battery storage continue to benefit from the need for new power generation, grid modernization, electrification trends, and the push for domestic energy supply. In the United States, renewable deployment is also supported by policy incentives and by power demand growth tied to data centers, industrial reshoring, and broader electrification.
The company’s strategy makes sense within that backdrop. It is positioned in large-scale project execution, where customers need a contractor with specialized experience, labor capacity, procurement know-how, and the ability to handle increasingly complex projects that combine solar, storage, and transmission-related work. The added operations and maintenance business gives SOLV Energy a recurring service layer after construction is complete, which can help smooth results over time even if it remains a smaller portion of total sales.
A notable positive is that the company has already shown it can convert industry growth into much better financial performance. Revenue accelerated strongly year over year, and the move from losses to solid profitability suggests it is not only benefiting from market demand but also improving execution. Revenue per share has been uneven over the last few years, reflecting the timing nature of project work, but the latest rebound is significant.
The strongest catalysts are likely to come from continued utility-scale solar and storage awards, expansion of backlog, and growth in higher-value integrated projects. If more developers prioritize experienced partners to manage complex builds, SOLV Energy could capture a larger share of spending without needing to become a power owner itself. Public company materials in 2026 also point to ongoing demand visibility tied to large U.S. energy infrastructure pipelines, which supports the case for continued activity even if individual quarters remain lumpy.
Risks
This article is for informational purposes only and does not constitute financial advice. Some content is AI-generated. See Disclaimer


