Stock Analysis · Murphy Oil Corporation (MUR)
Overview
Murphy Oil Corporation is an independent oil and gas exploration and production company. In simple terms, it looks for underground hydrocarbon resources, develops wells, produces crude oil and natural gas, and sells those volumes into the market. The company focuses on upstream activities rather than refining, chemicals, or fuel retailing, so its results depend heavily on production levels, commodity prices, operating costs, and the quality of its reserves.
Murphy’s asset base is centered on offshore and onshore production in the Gulf of Mexico and in Canada, with additional exploration interests in other regions. Its portfolio has been shaped around liquids-weighted production, which matters because oil often generates stronger margins than dry natural gas. Based on recent company reporting, revenue is overwhelmingly tied to hydrocarbon sales rather than service income or downstream operations.
The main sources of revenue are approximately the following:
- Crude oil sales: about 75% to 85% of total revenue in recent periods. This is the company’s largest earnings driver and includes offshore Gulf of Mexico production and Canadian output.
- Natural gas sales: about 10% to 20% of total revenue. This includes produced gas sold into regional markets.
- Natural gas liquids and other hydrocarbon sales: about 3% to 8% of total revenue, depending on pricing and production mix.
- Other operating revenue: typically a very small share and may include transportation, handling, or miscellaneous items when reported.
Geographically, production is mainly tied to the United States, especially the Gulf of Mexico, and Canada, with a smaller contribution from other international assets and exploration positions. That gives Murphy exposure to high-value offshore production, but it also means the company is more concentrated than the largest integrated energy groups.
Over the last several years, the business showed how cyclical upstream oil production can be: revenue and profits surged in the stronger commodity environment of 2022 and 2023, then moderated as prices and margins cooled. Interest expense has come down from earlier levels, which suggests the balance sheet has improved, but earnings remain sensitive to market conditions.
The financial flow over recent years shows a very strong peak in 2022 and then a clear step-down in revenue, operating income, and net income through 2025. One positive point is that financing pressure eased as interest expense trended lower than in 2021, but the core message remains that Murphy’s cash generation moves sharply with oil and gas prices.
Key Figures
| Metric | Value | Sector ⓘ |
|---|---|---|
| Date | Oct 10, 2026 | |
| Context | ||
| Sector | Energy | |
| Industry | Oil & Gas E&P | |
| Market Cap ⓘ | $5.42B | |
| Beta ⓘ | 0.58 | |
Value (Cheapness) | ||
| P/E Ratio ⓘ | 18.71 | 14.91 |
| P/B Ratio ⓘ | 1.06 | 1.67 |
| FCF Yield ⓘ | 6.09% | 8.53% |
| Dividend Yield ⓘ | 3.52% | 3.63% |
| EBIT / EV ⓘ | -408.06% | 7.44% |
| PEG ⓘ | 0.33 | |
Growth (Business expansion) | ||
| Revenue Growth ⓘ | 35.60% | 27.10% |
| RPS Growth (5Y CAGR) ⓘ | 0.71% | 6.85% |
| EPS Growth (5Y CAGR) ⓘ | -25.37% | -15.33% |
| BVPS Growth (5Y CAGR) ⓘ | 6.54% | 6.02% |
| Margin Growth (5Y Trend) ⓘ | 0.92% | 0.64% |
| FCF Growth (5Y CAGR) ⓘ | -14.27% | 3.59% |
| DPS Growth (5Y CAGR) ⓘ | 26.78% | 16.79% |
Quality (Business durability) | ||
| ROIC (Latest) ⓘ | -248.99% | 11.33% |
| ROA (Latest) ⓘ | 2.94% | 6.03% |
| ROIC (5Y Median) ⓘ | 8.82% | 10.19% |
| ROA (5Y Median) ⓘ | 4.19% | 5.40% |
| Net Debt / EBIT (Latest) ⓘ | N/A | 1.60 |
| Net Debt / EBIT (5Y Median) ⓘ | 2.44 | 1.91 |
| Net Debt / EBITDA (Latest) ⓘ | N/A | 1.05 |
| Net Debt / Assets ⓘ | 17.29% | 17.29% |
| EBITDA / Interest ⓘ | N/A | 9.65 |
| Operating Margin (Latest) ⓘ | -940.85% | 16.21% |
| Operating Margin (5Y Median) ⓘ | 22.31% | 19.99% |
| Debt to Equity (Latest) ⓘ | 43.00% | 54.41% |
| Profit Margin (Latest) ⓘ | 9.83% | 8.79% |
| Free Cash Flow (Latest) ⓘ | $329.79M | |
Momentum (Price trend) | ||
| 3Y Return ⓘ | -1.42% | +70.76% |
| 12M Return (excl. last month) ⓘ | +52.14% | +46.44% |
| 6M Return ⓘ | -11.19% | +0.36% |
| Price vs. 200-Day MA ⓘ | +4.89% | +8.00% |
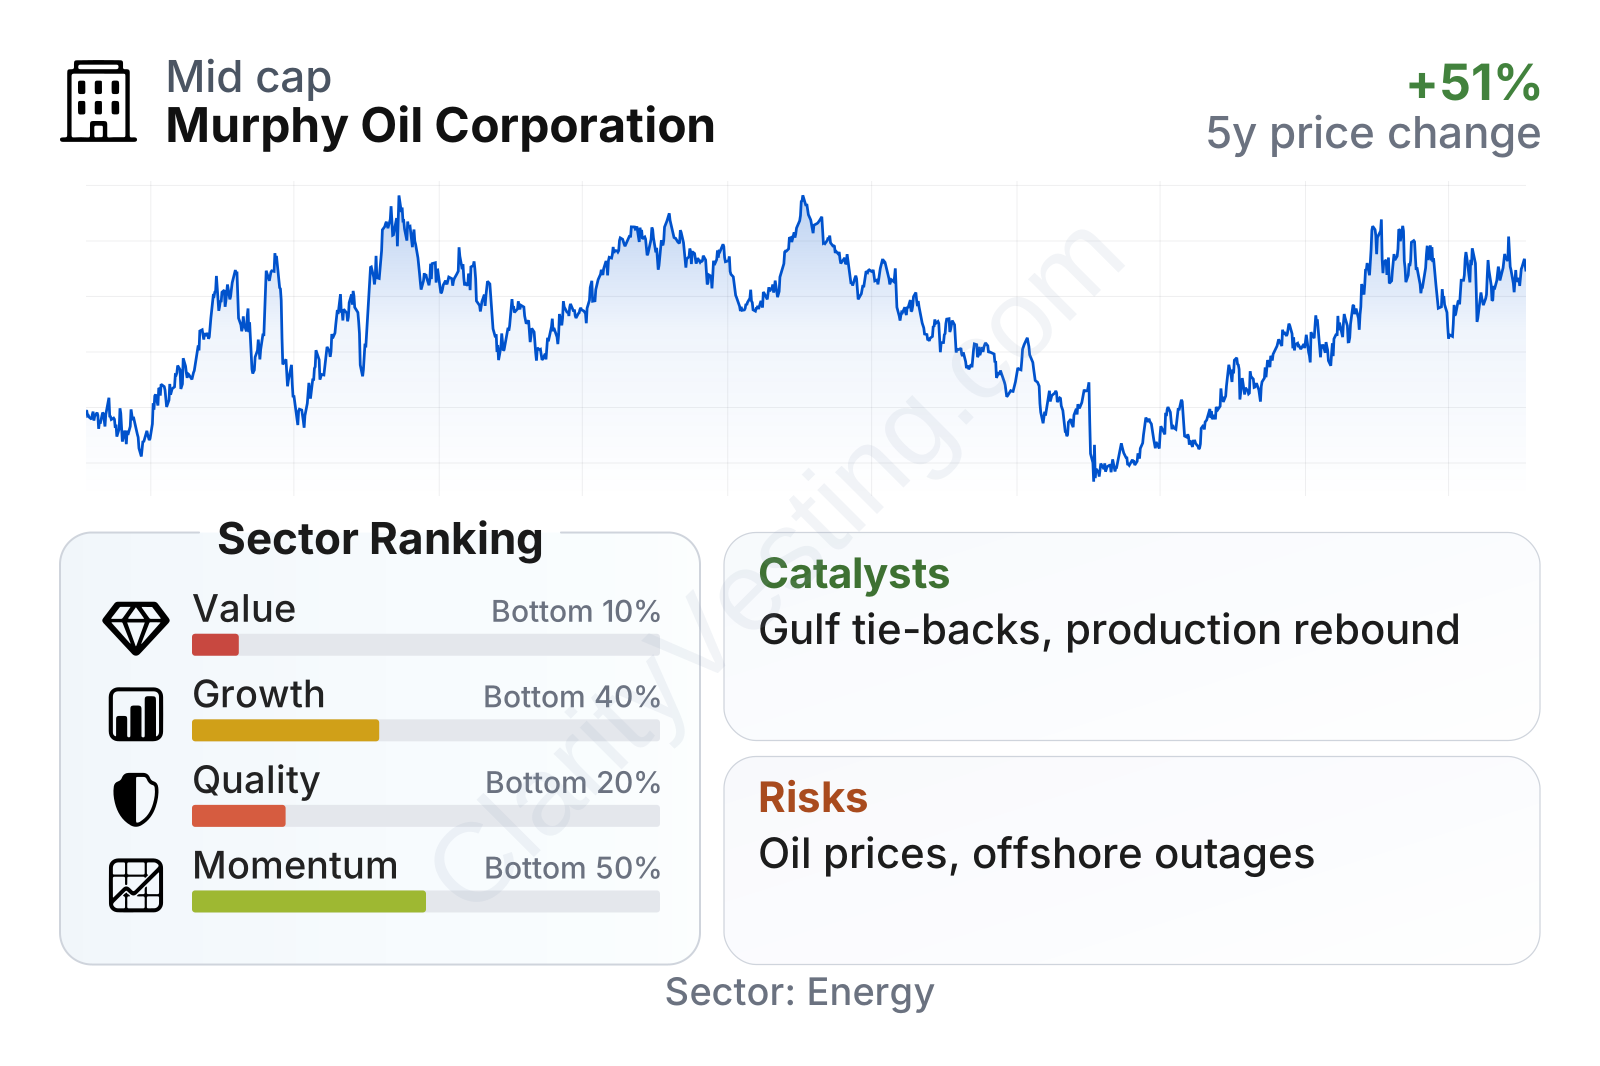
Murphy is a mid-sized energy producer with a market value a little above $5 billion, so it is meaningful in scale but still much smaller than global oil majors. The stock’s beta is below 0.5, which is unusually low for an exploration and production company, although the share price history still shows large swings tied to the energy cycle. After climbing strongly in parts of 2022 and 2024, the stock also experienced a sharp drop in 2025 before recovering part of that decline in 2026.
The factor snapshot is mixed. On valuation, the company ranks in the lower part of the sector even though its price-to-book ratio is below the sector median; that weak ranking is largely explained by weaker cash-based and operating-based valuation measures. On growth, the picture is uneven: recent year-over-year revenue growth rebounded strongly, but five-year revenue-per-share and free-cash-flow trends remain soft. On quality, Murphy looks weaker than many peers because current returns on capital and operating margin have been pressured, even though net profit margin remains close to or slightly above the sector median. In short, the company currently screens better on balance sheet discipline than on operating quality.
Growth
Murphy operates in a sector that will likely remain economically important for many years, but it is not a classic high-growth industry. Long-term demand for oil and gas still benefits from transportation, petrochemicals, industrial use, and energy security concerns. At the same time, the industry faces structural limits from energy transition policies, electrification, and the fact that upstream growth often depends more on finding attractive reservoirs and managing costs than on simple demand expansion.
Murphy’s growth strategy is sensible for its niche. The company has focused on offshore Gulf of Mexico projects, where individual wells can add meaningful production, and on maintaining a disciplined capital program rather than pursuing size for its own sake. For a company of Murphy’s scale, this approach matters: one or two successful projects can materially change production, free cash flow, and reserve life.
Revenue growth has been highly volatile, which is typical for an upstream producer. After a long stretch of contraction, recent periods turned positive again, including a strong rebound into 2026. That suggests Murphy is benefiting from a mix of production additions, timing effects, and a somewhat improved sales environment, but the long-term pattern still looks cyclical rather than steadily compounding.
Free cash flow tells a similar story. Murphy generated strong cash surpluses during favorable market conditions, but trailing cash generation dropped sharply from earlier highs before stabilizing at a much lower level. The company still produces positive free cash flow, which is important, yet the decline shows how quickly upstream economics can change when prices soften, output shifts, or capital spending rises.
One of the most important growth catalysts is execution on new offshore developments and tie-backs in the Gulf of Mexico. These projects can be attractive because they often connect to existing infrastructure, which lowers development time and cost versus entirely new platforms. Another support factor is portfolio simplification: Murphy has spent years narrowing its focus around assets with stronger returns and lower strategic complexity.
Recent company updates have also emphasized operational progress, capital discipline, and shareholder returns. For long-term analysis, the more important takeaway is not the headline distribution of cash but whether new production can offset natural field declines while keeping debt under control. If Murphy can continue adding efficient barrels from its core areas, it can improve scale and cash generation without becoming an overly leveraged operator.
Risks
This article is for informational purposes only and does not constitute financial advice. Some content is AI-generated. See Disclaimer