Stock Analysis · MTN Group Ltd PK (MTNOY)
Overview
MTN Group is one of the largest mobile telecommunications companies in Africa and parts of the Middle East. The group provides mobile voice, mobile data, fiber connectivity, enterprise telecom services, digital services, and financial technology offerings such as mobile money. Its footprint is spread across large and fast-growing markets including Nigeria, Ghana, Uganda, Côte d’Ivoire, Cameroon, South Africa, and several other countries, which makes the business less dependent on any one economy, although Nigeria is especially important.
The company’s revenue mix is driven mainly by services sold to consumers and businesses over its mobile networks. Based on recent annual reporting from the group, the largest sources of revenue are broadly organized as follows:
- Data services: approximately 40% to 45% of service revenue. This includes mobile internet access used for messaging, video, social media, streaming, and app usage.
- Voice services: approximately 25% to 30%. This is traditional calling revenue, still meaningful in many of MTN’s markets even as data becomes more important.
- Fintech: approximately 15% to 20%. This includes mobile money transfers, payments, merchant services, remittances, and in some markets lending or insurance-related services through partners.
- Digital, enterprise, and wholesale services: approximately 10% to 15% combined. These activities include business connectivity, cloud and communications solutions, digital content, carrier services, and infrastructure-related revenue.
- Device and other revenue: a smaller share, generally below 10%, depending on the period and market.
Geographically, Nigeria is the biggest earnings engine, with other major contributors coming from Ghana, Uganda, and Francophone West and Central African markets. That country mix matters because MTN’s long-term results are shaped not only by customer growth, but also by local currencies, regulation, and inflation. Even so, the business model is relatively straightforward: build and operate telecom networks, add more users, encourage heavier data usage, and monetize digital payments on top of that customer base.
The long-term financial pattern has been uneven at the bottom line because of currency movements, taxes, and one-off items, but the operating engine remains substantial. Revenue has recovered after a difficult 2024, and operating income rebounded strongly in 2025, suggesting that underlying demand for connectivity and digital financial services remains intact.
The income flow highlights a business with large gross profit generation but also meaningful swings between operating profit and net income. Interest expense has stayed significant, and currency-related pressure has at times prevented strong operating performance from fully translating into reported earnings.
Key Figures
| Metric | Value | Sector ⓘ |
|---|---|---|
| Date | Oct 17, 2026 | |
| Context | ||
| Sector | Communication Services | |
| Industry | Telecom Services | |
| Market Cap ⓘ | $20.49B | |
| Beta ⓘ | 0.89 | |
Value (Cheapness) | ||
| P/E Ratio ⓘ | 19.61 | 17.78 |
| FCF Yield ⓘ | 380.61% | 14.20% |
| Dividend Yield ⓘ | 2.70% | 2.74% |
| EBIT / EV ⓘ | N/A | 4.52% |
| PEG ⓘ | 0.56 | |
Growth (Business expansion) | ||
| Revenue Growth ⓘ | 8.80% | 5.50% |
| RPS Growth (5Y CAGR) ⓘ | 3.82% | 4.55% |
| EPS Growth (5Y CAGR) ⓘ | 199.47% | -18.24% |
| Margin Growth (5Y Trend) ⓘ | 10.92% | 1.03% |
| FCF Growth (5Y CAGR) ⓘ | 6.82% | 5.96% |
| DPS Growth (5Y CAGR) ⓘ | -22.05% | 5.00% |
Quality (Business durability) | ||
| ROIC (Latest) ⓘ | 32.52% | 8.59% |
| ROIC (5Y Median) ⓘ | 14.57% | 8.24% |
| Net Debt / EBIT (Latest) ⓘ | 0.98 | 1.89 |
| Net Debt / EBIT (5Y Median) ⓘ | 1.93 | 2.81 |
| Net Debt / EBITDA (Latest) ⓘ | 0.58 | 1.14 |
| Net Debt / Assets ⓘ | 23.28% | 18.62% |
| EBITDA / Interest ⓘ | 4.16 | 8.36 |
| Operating Margin (Latest) ⓘ | 25.86% | 15.53% |
| Operating Margin (5Y Median) ⓘ | 23.10% | 13.39% |
| Debt to Equity (Latest) ⓘ | 110.72% | 59.53% |
| Profit Margin (Latest) ⓘ | 7.52% | 8.77% |
| Free Cash Flow (Latest) ⓘ | $77.97B | |
Momentum (Price trend) | ||
| 3Y Return ⓘ | +122.36% | +44.75% |
| 12M Return (excl. last month) ⓘ | +64.65% | +2.72% |
| 6M Return ⓘ | -8.08% | +1.84% |
| Price vs. 200-Day MA ⓘ | -6.87% | +1.21% |
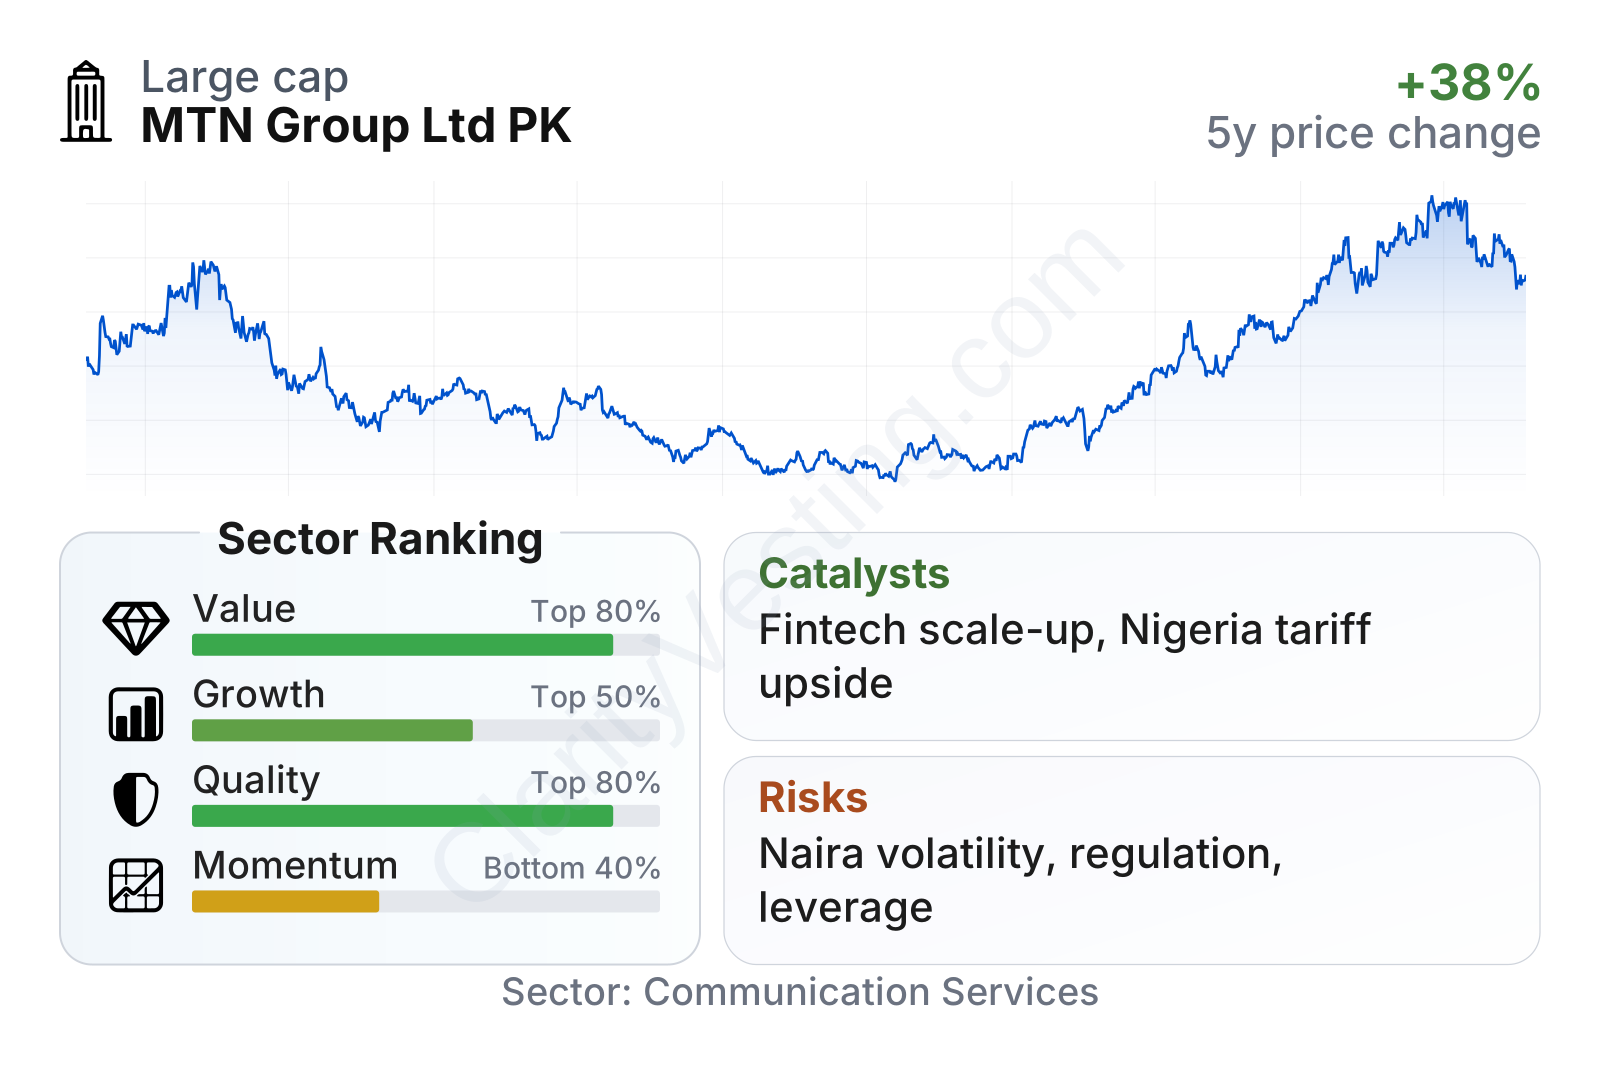
MTN stands out as a large telecom operator with a mixed but generally solid financial profile. On growth and momentum, it ranks around the middle to upper half of its sector, while on quality and value measures it screens better than many peers. Revenue growth has recently run ahead of the sector median, free cash flow generation looks strong, and returns on invested capital are notably high. Leverage is manageable by earnings-based measures, but debt remains elevated relative to equity and interest coverage is not especially wide, which means balance-sheet discipline still matters.
The stock’s multi-year performance has been strong after a long volatile stretch. That rebound shows the market has started to recognize operational recovery, but it also means the current valuation should be judged against improving fundamentals rather than against the depressed price levels seen in 2024 and early 2025.
Growth
MTN operates in a sector with durable structural demand. Across its markets, mobile connectivity remains essential infrastructure, and smartphone adoption, video consumption, digital payments, and business digitization still have room to expand. In many African economies, telecom groups are not just network providers; they are also distribution platforms for payments and everyday financial transactions. That gives MTN exposure to two long-term growth themes at once: rising data consumption and financial inclusion.
The company’s strategy is coherent for this environment. Management has emphasized network investment, 4G and 5G expansion where returns justify it, customer growth, deeper use of smartphones, and continued scaling of fintech. This is an important combination because data and fintech generally offer better long-term growth potential than legacy voice services. MTN also benefits from scale: a very large subscriber base allows it to spread network costs, cross-sell new services, and negotiate equipment and handset partnerships from a stronger position than smaller local rivals.
Revenue growth has not been smooth, largely because reported results are heavily affected by currency translation and macroeconomic instability in some markets. After double-digit gains in 2022 and 2023, growth turned negative in 2024 before recovering sharply in 2025. That pattern suggests the main issue was not a collapse in demand for telecom services, but the difficult operating backdrop. The latest year-over-year trend is back above the sector median, which supports the view that MTN’s core demand drivers remain healthy.
A major catalyst is the company’s fintech business. Mobile money ecosystems in Africa can become increasingly valuable as they add users, merchants, payment use cases, remittances, and business services. MTN already has a very large mobile subscriber base, so it does not need to build customer trust from scratch. Another catalyst is tariff normalization in markets facing high inflation, especially where regulators eventually allow operators to raise prices to support network investment. When price increases are combined with traffic growth, revenue can improve quickly.
Recent company updates have also pointed to stronger operational traction in important markets, including continued data usage growth, fintech expansion, and progress on expense discipline and portfolio simplification. Those developments matter because they improve the chance that future revenue growth can translate into cash flow more consistently than in the recent past.
Risks
This article is for informational purposes only and does not constitute financial advice. Some content is AI-generated. See Disclaimer


