Stock Analysis · MSC Industrial Direct Company Inc (MSM)
Overview
MSC Industrial Direct is a large U.S. distributor of metalworking and maintenance, repair, and operations products. In simple terms, it helps factories, machine shops, and other industrial customers buy the tools, cutting equipment, safety supplies, fasteners, and other everyday items they need to keep production running. The company mainly serves customers in manufacturing, but it also supports government and institutional buyers through a broad catalog, e-commerce tools, field sales teams, vending solutions, and inventory management services.
Its business model is based on supplying a very wide range of industrial products and pairing that product breadth with service. Customers often do not come to MSC for one flagship item; they use it as a purchasing platform for many recurring needs. That makes the company closer to an industrial supply partner than a pure product manufacturer.
Based on company disclosures, MSC’s revenue is overwhelmingly generated from product sales in North America, with the customer mix led by manufacturing end markets. Public filings do not break revenue into many exact product-line percentages every quarter, but the broad mix is clear enough to summarize.
- Metalworking products: approximately 30% to 35% of revenue. This includes cutting tools, abrasives, measuring instruments, machine tool accessories, and other items tied directly to production activity.
- MRO and other industrial supplies: approximately 65% to 70% of revenue. This includes safety products, janitorial supplies, fasteners, fluid power, material handling, electrical items, and general plant maintenance products.
- Geographic exposure: approximately 95%+ of sales come from the United States, with the remainder primarily from Canada, the United Kingdom, and limited international operations.
- Sales channels: most revenue comes from public and private sector industrial customers purchasing through e-commerce, inside sales, field sales, and managed inventory programs rather than from consumer channels.
One important pattern in recent years is that revenue has stayed relatively stable near the upper end of its historical range, but profitability has come under pressure as operating costs rose and customers became more cautious. That mix of resilient sales and softer margins is central to understanding the stock today.
The flow of revenue into profit shows a business with solid gross profit generation, but also meaningful operating expense pressure. Sales peaked in fiscal 2023, then eased in fiscal 2024 and fiscal 2025, while net income fell more sharply than revenue, indicating that margin compression has mattered more than top-line change.
Key Figures
| Metric | Value | Sector ⓘ |
|---|---|---|
| Date | Oct 24, 2026 | |
| Context | ||
| Sector | Industrials | |
| Industry | Industrial Distribution | |
| Market Cap ⓘ | $7.28B | |
| Beta ⓘ | 0.81 | |
Value (Cheapness) | ||
| P/E Ratio ⓘ | 31.29 | 22.29 |
| P/B Ratio ⓘ | 5.24 | 1.98 |
| FCF Yield ⓘ | 3.02% | 6.26% |
| Dividend Yield ⓘ | 2.71% | 1.92% |
| EBIT / EV ⓘ | 4.58% | 4.83% |
| PEG ⓘ | 2.48 | |
Growth (Business expansion) | ||
| Revenue Growth ⓘ | 7.80% | 9.30% |
| RPS Growth (5Y CAGR) ⓘ | 3.92% | 7.76% |
| EPS Growth (5Y CAGR) ⓘ | -14.80% | -13.17% |
| BVPS Growth (5Y CAGR) ⓘ | 4.99% | 6.13% |
| Margin Growth (5Y Trend) ⓘ | -1.71% | 0.74% |
| FCF Growth (5Y CAGR) ⓘ | 8.99% | 10.79% |
| DPS Growth (5Y CAGR) ⓘ | -14.89% | 9.41% |
Quality (Business durability) | ||
| ROIC (Latest) ⓘ | 13.13% | 10.75% |
| ROA (Latest) ⓘ | 9.30% | 5.41% |
| ROIC (5Y Median) ⓘ | 14.36% | 9.37% |
| ROA (5Y Median) ⓘ | 10.33% | 4.95% |
| Net Debt / EBIT (Latest) ⓘ | 1.45 | 2.04 |
| Net Debt / EBIT (5Y Median) ⓘ | 1.68 | 2.27 |
| Net Debt / EBITDA (Latest) ⓘ | 1.11 | 1.39 |
| Net Debt / Assets ⓘ | 19.29% | 19.27% |
| EBITDA / Interest ⓘ | 19.52 | 9.58 |
| Operating Margin (Latest) ⓘ | 8.51% | 10.49% |
| Operating Margin (5Y Median) ⓘ | 9.64% | 10.30% |
| Debt to Equity (Latest) ⓘ | 39.13% | 64.82% |
| Profit Margin (Latest) ⓘ | 5.92% | 6.67% |
| Free Cash Flow (Latest) ⓘ | $219.93M | |
Momentum (Price trend) | ||
| 3Y Return ⓘ | +52.37% | +67.77% |
| 12M Return (excl. last month) ⓘ | +38.73% | +12.05% |
| 6M Return ⓘ | +37.76% | 0.00% |
| Price vs. 200-Day MA ⓘ | +23.62% | +0.67% |
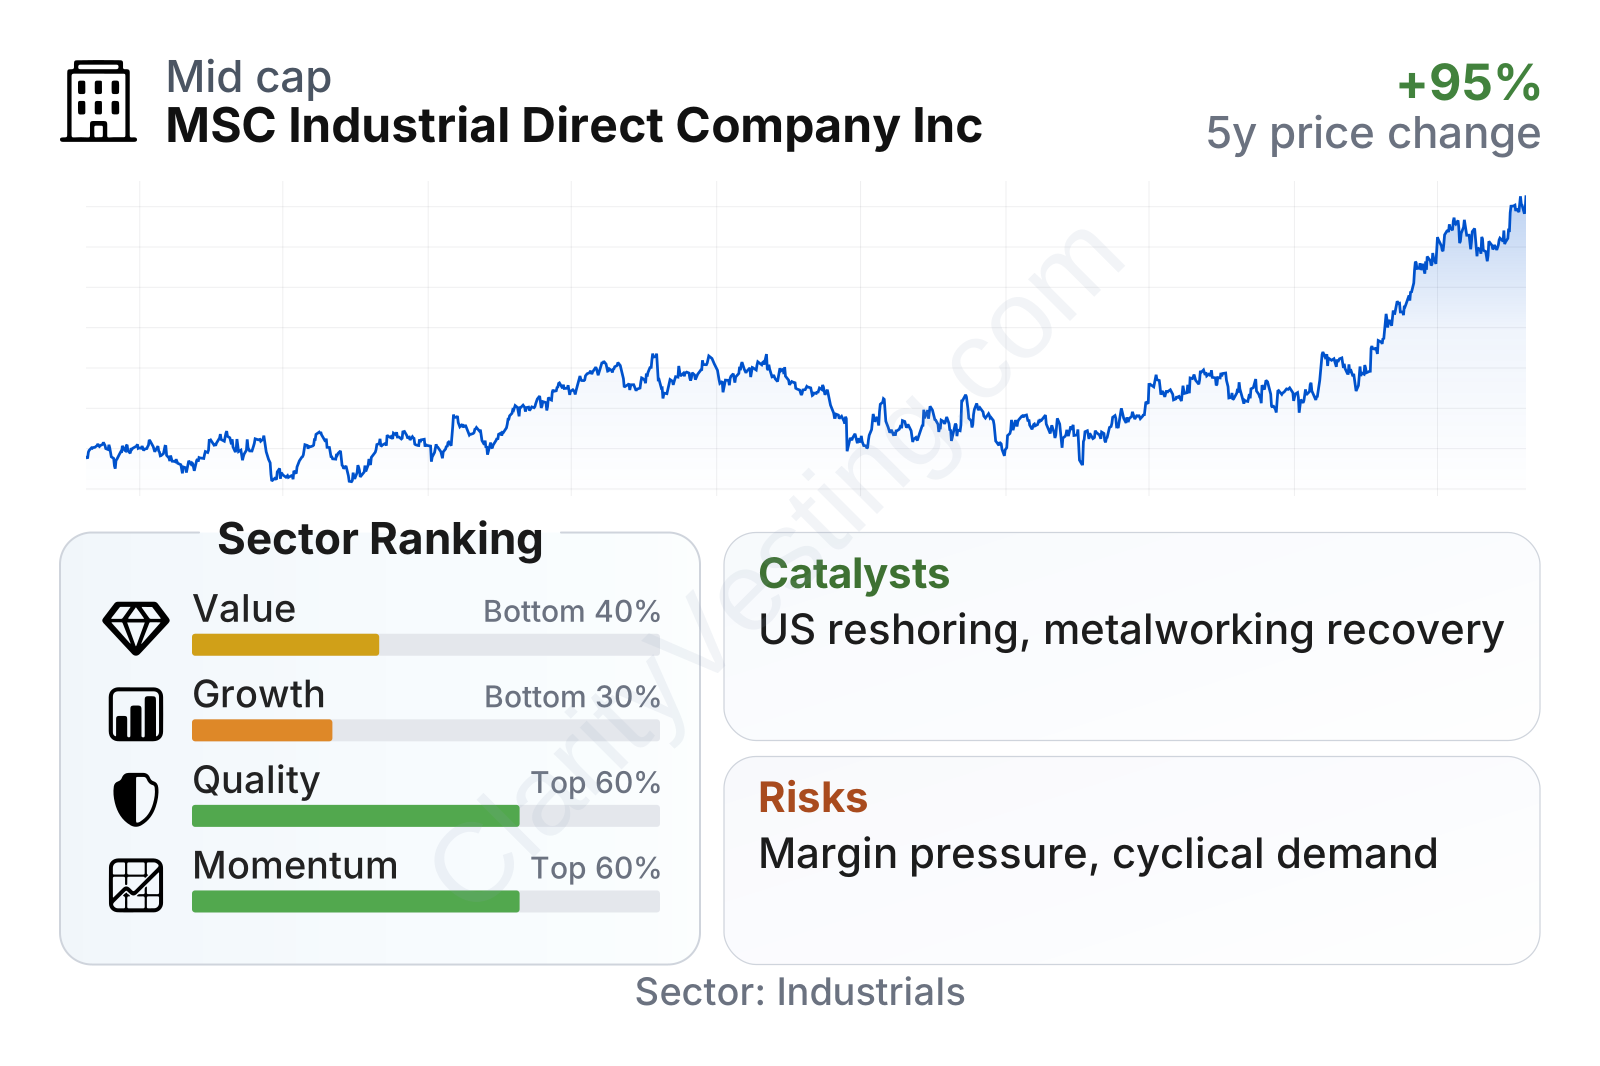
MSC Industrial Direct is a mid-to-large industrial distributor with a stock that has strengthened sharply over the last 12 months, even though its longer-term growth record remains modest. The company stands out more for business quality than for growth or cheapness. Returns on capital and assets are stronger than the sector median, and leverage is relatively conservative, but valuation multiples currently sit above sector norms while growth metrics rank in the lower part of the peer group.
Growth
MSC operates in a sector that should keep benefiting over time from U.S. manufacturing activity, factory automation, supply-chain localization, and the need for plants to run with less downtime. Industrial distribution is not a fast-changing consumer category, but it can grow steadily when customers consolidate suppliers, increase digital purchasing, and outsource more procurement tasks. That gives MSC an understandable long-term lane: become more embedded in customer operations rather than simply ship products.
The company’s strategy broadly fits that goal. Management has been emphasizing high-touch technical categories such as metalworking, along with vending, in-plant solutions, and digital tools that make replenishment easier for customers. These services can deepen relationships and raise switching costs because once a factory integrates a distributor into workflow, inventory control, and purchasing systems, changing providers becomes more disruptive.
Recent growth has not been smooth. Revenue growth was strong in 2022 and early 2023, then turned negative through much of 2024 before recovering back into positive territory more recently. That pattern suggests MSC is highly tied to the industrial cycle: when customer production slows, order sizes and frequency weaken quickly. The more encouraging sign is that growth has turned positive again, showing at least a partial rebound in demand.
Cash generation remains another important growth support, even though it has come down from earlier peaks. Free cash flow is still positive and substantial, which gives MSC flexibility to keep investing in distribution capacity, technology, acquisitions, and shareholder returns without stretching the balance sheet. The decline from prior highs does show that the business is not in a clean acceleration phase, but it still has the financial capacity to pursue its strategy.
A notable catalyst is the broader push to expand domestic manufacturing capacity in the United States, especially in aerospace, defense-related production, infrastructure-linked fabrication, and reshoring-sensitive industries. MSC is not the direct builder of factories, but it can benefit when more plants need recurring consumables and metalworking tools. Another useful catalyst is customer consolidation: large buyers often prefer fewer vendors, and scale players like MSC are well positioned when procurement becomes more centralized.
Recent company communications have also highlighted efforts around core customer growth, national accounts, and category penetration. None of this points to explosive expansion, but it does support the case for gradual share gains if industrial demand improves.
Risks
This article is for informational purposes only and does not constitute financial advice. Some content is AI-generated. See Disclaimer


