Stock Analysis · Morgan Stanley Direct Lending Fund (MSDL)
Overview
Morgan Stanley Direct Lending Fund is a business development company, or BDC. In simple terms, it raises money from shareholders and lenders, then uses that capital to make loans to middle-market companies, mostly private businesses that are too large for small-bank lending but too small to rely heavily on public bond markets. The fund is externally managed by Morgan Stanley Investment Management, which gives it access to Morgan Stanley’s credit platform, underwriting network, and sponsor relationships.
The business is built around earning interest and fees on a portfolio of loans and other debt investments. Like many BDCs, it also uses borrowed money to increase the size of its investment portfolio. That structure can produce strong income when credit conditions are healthy, but it also makes results sensitive to borrower performance, interest rates, and credit losses.
Based on recent company reporting, revenue is heavily concentrated in investment income tied to lending activity. The broad sources of revenue can be described as follows:
- Interest income from debt investments: approximately 85% to 95% of total investment income. This mainly comes from first-lien senior secured loans, with additional exposure to second-lien loans and other income-producing credit instruments.
- Fee income: approximately 3% to 10%. This can include original issue discount accretion, prepayment fees, amendment fees, and structuring-related income earned when loans are originated or repaid.
- Dividend income and other investment income: typically 0% to 5%. This is a smaller contributor and may include income from equity co-investments or other structured positions.
- Net realized and unrealized gains: variable and not a stable operating revenue source. These valuation movements can materially affect net income, but they are less predictable than recurring interest income.
The portfolio strategy centers on senior secured lending, which usually sits higher in the repayment line if a borrower runs into trouble. That gives the company a more defensive profile than lenders that rely more heavily on junior debt or equity stakes, although it does not remove credit risk.
A notable operating pattern over the last several years is that total revenue expanded strongly from 2021 through 2025, but net income became more volatile as funding costs and other expense items moved around. In other words, the lending platform has grown, yet the translation from revenue into shareholder earnings has become less smooth.
The long-term picture shows a much larger revenue base than a few years ago, which reflects portfolio expansion. At the same time, interest expense has also risen, reminding readers that this is a leveraged income vehicle: growth in assets helps, but the cost of financing those assets matters a great deal.
Key Figures
| Metric | Value | Sector ⓘ |
|---|---|---|
| Date | Oct 17, 2026 | |
| Context | ||
| Sector | Financial Services | |
| Industry | Asset Management | |
| Market Cap ⓘ | $1.09B | |
| Beta ⓘ | 0.68 | |
Value (Cheapness) | ||
| P/E Ratio ⓘ | 19.09 | 12.26 |
| P/B Ratio ⓘ | 0.68 | 1.23 |
| FCF Yield ⓘ | 25.92% | 10.40% |
| Dividend Yield ⓘ | 14.45% | 3.02% |
| EBIT / EV ⓘ | N/A | 8.14% |
| PEG ⓘ | N/A | |
Growth (Business expansion) | ||
| Revenue Growth ⓘ | -10.80% | 9.35% |
| RPS Growth (5Y CAGR) ⓘ | 41.15% | 12.19% |
| EPS Growth (5Y CAGR) ⓘ | 12.23% | -9.53% |
| BVPS Growth (5Y CAGR) ⓘ | 10.44% | 4.99% |
| Margin Growth (5Y Trend) ⓘ | -88.12% | -3.86% |
| FCF Growth (5Y CAGR) ⓘ | 22.19% | 4.81% |
| DPS Growth (5Y CAGR) ⓘ | 48.56% | 8.79% |
Quality (Business durability) | ||
| ROIC (Latest) ⓘ | N/A | 9.49% |
| ROE (Latest) ⓘ | 3.49% | 13.90% |
| ROA (Latest) ⓘ | 1.56% | 1.55% |
| ROIC (5Y Median) ⓘ | N/A | 7.86% |
| ROE (5Y Median) ⓘ | 11.17% | 12.17% |
| ROA (5Y Median) ⓘ | 5.29% | 1.30% |
| Net Debt / EBIT (Latest) ⓘ | N/A | 0.96 |
| Net Debt / EBIT (5Y Median) ⓘ | 13.53 | 0.73 |
| Net Debt / EBITDA (Latest) ⓘ | 12.21 | 0.92 |
| Operating Margin (Latest) ⓘ | N/A | 22.30% |
| Operating Margin (5Y Median) ⓘ | 67.72% | 24.63% |
| Debt to Equity (Latest) ⓘ | 120.27% | 58.56% |
| Profit Margin (Latest) ⓘ | 15.97% | 26.57% |
| Free Cash Flow (Latest) ⓘ | $282.91M | |
Momentum (Price trend) | ||
| 3Y Return ⓘ | N/A | +88.33% |
| 12M Return (excl. last month) ⓘ | -5.18% | +19.38% |
| 6M Return ⓘ | -7.77% | +4.75% |
| Price vs. 200-Day MA ⓘ | -6.96% | +3.50% |
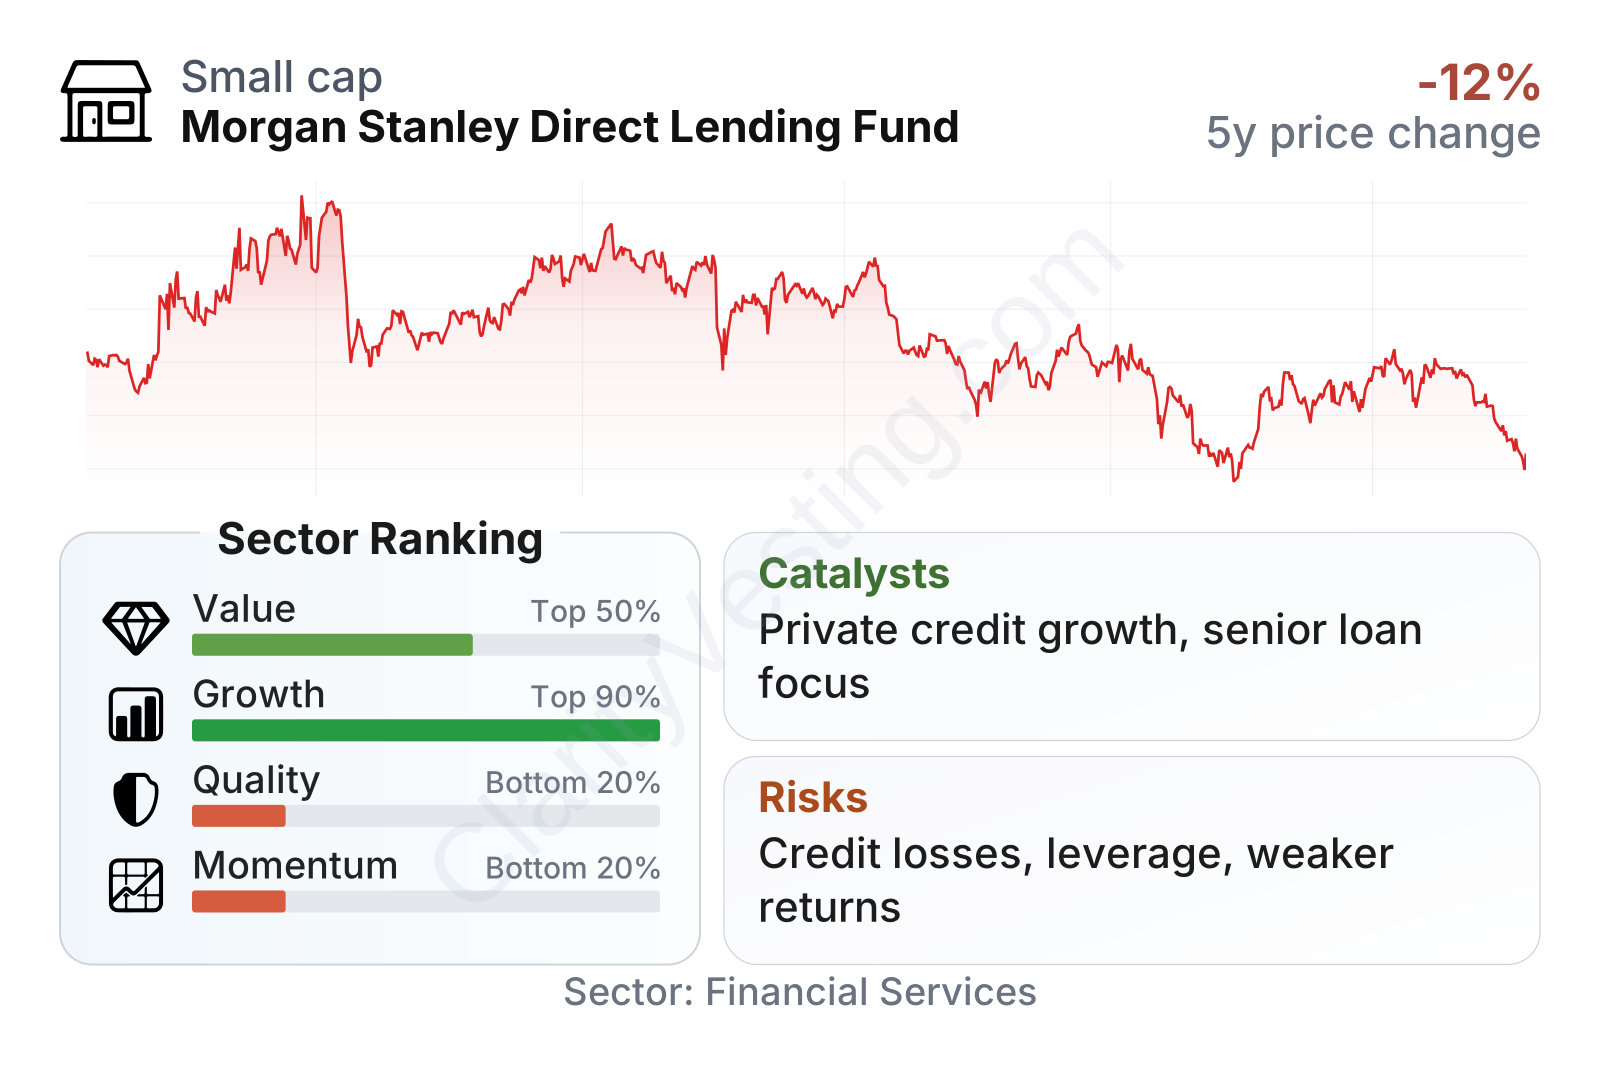
Morgan Stanley Direct Lending Fund is a relatively small public financial company by market value, and its share price has been fairly muted recently. The latest factor snapshot is mixed: value metrics look favorable in some areas, especially price-to-book and dividend yield, while quality and momentum rank weakly versus much of the sector. Growth indicators are stronger over a multiyear view than over the last twelve months, which suggests that the recent period has been softer than the broader buildout since listing.
The stock’s beta is below 1, which means its price has historically moved less sharply than the overall market. That lower volatility can be appealing on the surface, but for a BDC the bigger issue is often not daily price swings; it is whether loan performance, net asset value, and dividend coverage remain stable through credit cycles.
Growth
The company operates in a part of the market that has grown meaningfully over the past decade: private credit and direct lending. Banks have become more constrained in some types of middle-market lending, while private equity firms continue to need financing for acquisitions, refinancings, and add-on deals. That backdrop has supported the rise of large direct lenders, especially those with institutional sponsors and broad origination networks.
MSDL’s strategy fits that trend. Its connection to Morgan Stanley gives it access to a recognized brand, sponsor-backed deal flow, and a wider investment platform than many standalone BDCs can match. The focus on senior secured loans also aligns with what many income-focused credit vehicles want in a late-cycle or uncertain environment: higher position in the capital structure and a stronger claim on collateral.
The multiyear growth record is solid in several areas. Revenue per share growth over five years has been well above the sector median, earnings per share growth over five years has also been positive, and book value per share has increased at a faster pace than the typical financial stock in its peer group. Those trends suggest that the platform has scaled up and, over time, added value per share despite the normal ups and downs of credit markets.
Earnings climbed sharply from 2023 to 2024, then eased in 2025. That pattern is not unusual for a BDC. Results can benefit when floating-rate loan yields rise, but they can also cool off when repayments increase, spreads tighten, funding costs rise, or credit marks move lower. The main takeaway is that MSDL has demonstrated earnings power, but not a straight-line growth path.
Book value per share rose strongly from 2021 through 2024 before dipping modestly in 2025. For a lender like this, book value is one of the most important measures to watch because it reflects the underlying value of the investment portfolio after liabilities. A moderate decline after several years of gains is manageable on its own, but it deserves attention because repeated erosion in book value can signal pressure on portfolio quality or valuation marks.
One of the clearest catalysts is continued expansion of private credit as an asset class. Another is the possibility of sustained demand for sponsor-backed direct lending, where speed, certainty, and structuring flexibility can matter more than traditional bank pricing. In addition, if interest rates remain at levels that support attractive loan yields without causing widespread borrower stress, BDC income generation can remain healthy. Public filings and investor materials also indicate an active portfolio management approach, which can help recycle capital into new opportunities as loans repay.
Risks
This article is for informational purposes only and does not constitute financial advice. Some content is AI-generated. See Disclaimer


