Stock Analysis · MSA Safety (MSA)
Overview
MSA Safety is a long-established industrial safety company that designs and sells products used to protect workers, first responders, and facilities. Its equipment is used in settings where failures can be costly or dangerous, including fire service, construction, utilities, manufacturing, mining, oil and gas, and military applications. The company’s portfolio includes self-contained breathing apparatus, firefighter helmets and protective gear, fixed gas and flame detection systems, portable gas detectors, and industrial head protection.
Its business is built around safety equipment that is often mission-critical, regulated, and replaced on recurring cycles. That usually makes demand more resilient than in many other industrial niches, although timing can still be affected by municipal budgets, industrial spending, and large project activity.
Based on recent company disclosures, revenue is mainly generated from the following categories:
- Fire service products: approximately 45% to 50% — breathing apparatus, firefighter helmets, thermal imaging, turnout gear, and related accessories sold largely to fire departments and emergency services.
- Detection products: approximately 30% to 35% — fixed gas and flame detection systems and portable gas detectors used in industrial plants, energy sites, and commercial facilities.
- Industrial personal protective equipment: approximately 15% to 20% — hard hats, industrial head protection, and related worker safety products.
- Other and service-related activity: a smaller share — replacement parts, maintenance, training, and adjacent safety offerings.
Geographically, MSA is diversified across the Americas, Europe, and international markets, with the Americas representing the largest portion of sales. The revenue mix matters because fire service and detection tend to carry stronger margins and can benefit from regulation, product refresh cycles, and installed-base follow-on sales.
The profit structure has improved meaningfully over the past few years. Sales have expanded from about $1.4 billion in 2021 to nearly $1.9 billion in 2025, while operating income and net income have risen much faster overall despite some temporary volatility in 2023. That pattern suggests the company has been lifting pricing, mix, and operating efficiency rather than relying on revenue growth alone.
The business flow shows a company that has become more profitable as it scaled. Revenue has grown steadily, and a larger share of that revenue has been retained as operating profit than a few years ago, which is consistent with the stronger margins seen more recently.
Key Figures
| Metric | Value | Sector ⓘ |
|---|---|---|
| Date | Oct 03, 2026 | |
| Context | ||
| Sector | Industrials | |
| Industry | Security & Protection Services | |
| Market Cap ⓘ | $6.97B | |
| Beta ⓘ | 0.94 | |
Value (Cheapness) | ||
| P/E Ratio ⓘ | 22.43 | 22.45 |
| P/B Ratio ⓘ | 4.95 | 1.98 |
| FCF Yield ⓘ | 5.09% | 6.31% |
| Dividend Yield ⓘ | 1.17% | 1.96% |
| EBIT / EV ⓘ | 5.93% | 4.81% |
| PEG ⓘ | 0.99 | |
Growth (Business expansion) | ||
| Revenue Growth ⓘ | 6.20% | 9.10% |
| RPS Growth (5Y CAGR) ⓘ | 7.64% | 7.75% |
| EPS Growth (5Y CAGR) ⓘ | -6.47% | -13.59% |
| BVPS Growth (5Y CAGR) ⓘ | 13.33% | 6.22% |
| Margin Growth (5Y Trend) ⓘ | 18.79% | 0.72% |
| FCF Growth (5Y CAGR) ⓘ | 18.46% | 10.98% |
| DPS Growth (5Y CAGR) ⓘ | 4.74% | 9.48% |
Quality (Business durability) | ||
| ROIC (Latest) ⓘ | 17.39% | 10.92% |
| ROA (Latest) ⓘ | 12.18% | 5.41% |
| ROIC (5Y Median) ⓘ | 16.88% | 9.21% |
| ROA (5Y Median) ⓘ | 7.53% | 4.94% |
| Net Debt / EBIT (Latest) ⓘ | 1.00 | 2.07 |
| Net Debt / EBIT (5Y Median) ⓘ | 1.71 | 2.28 |
| Net Debt / EBITDA (Latest) ⓘ | 0.85 | 1.43 |
| Net Debt / Assets ⓘ | 17.05% | 19.27% |
| EBITDA / Interest ⓘ | 15.99 | 9.53 |
| Operating Margin (Latest) ⓘ | 22.85% | 10.50% |
| Operating Margin (5Y Median) ⓘ | 17.03% | 10.27% |
| Debt to Equity (Latest) ⓘ | 45.91% | 65.48% |
| Profit Margin (Latest) ⓘ | 16.13% | 6.62% |
| Free Cash Flow (Latest) ⓘ | $354.30M | |
Momentum (Price trend) | ||
| 3Y Return ⓘ | +16.92% | +58.56% |
| 12M Return (excl. last month) ⓘ | +10.79% | +15.63% |
| 6M Return ⓘ | +9.14% | +4.19% |
| Price vs. 200-Day MA ⓘ | +1.39% | +0.93% |
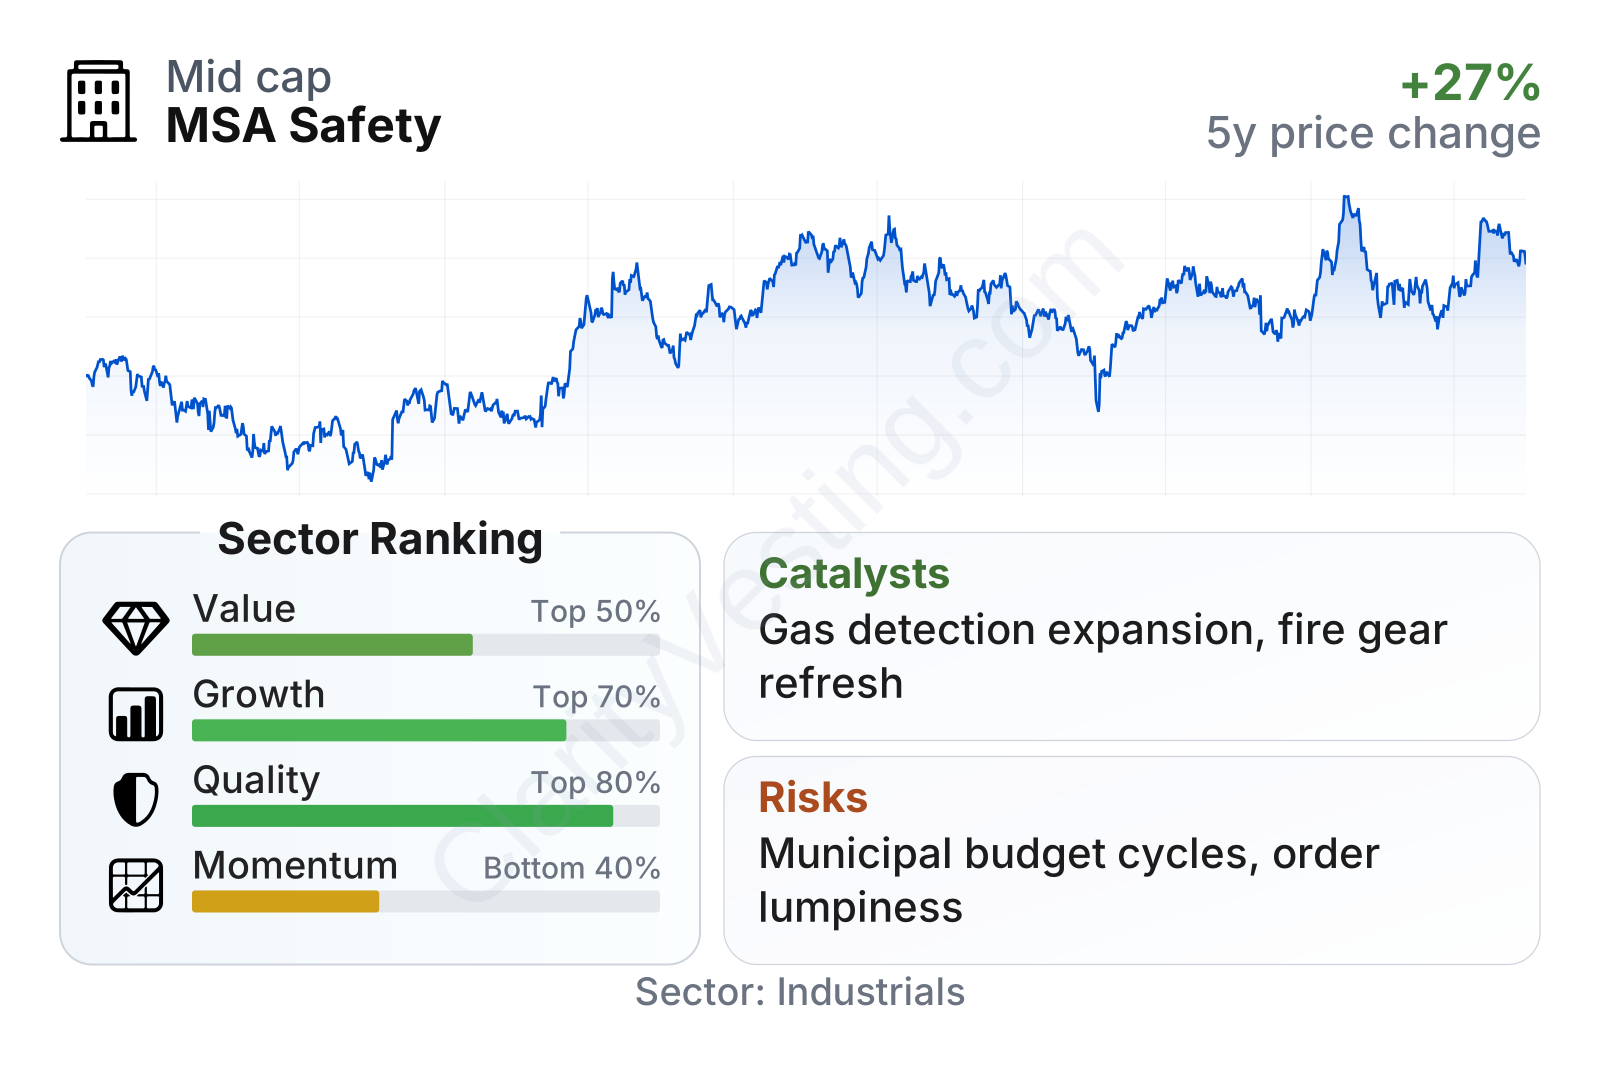
MSA Safety is a mid-sized industrial company with a market value around $7 billion and a stock volatility close to the broader market. The overall profile is strongest in quality, where returns on capital, returns on assets, margins, and balance-sheet leverage all compare well with much of the sector. Growth is more mixed: recent revenue expansion is positive but not exceptional, while cash flow growth and margin improvement over several years are notably stronger. Value looks broadly in line with the sector on earnings, although the price-to-book ratio is clearly richer, which reflects the market assigning a premium to profitability and business quality. Momentum is the weakest area, with the stock’s multi-year return lagging many industrial peers even though shorter-term trading has improved.
Growth
Worker safety is a healthy long-term market. Regulation, liability concerns, aging infrastructure, industrial automation, and stricter monitoring requirements all support ongoing demand for protective equipment and gas detection. In fire service, replacement cycles for breathing apparatus and protective gear create recurring demand. In industrial detection, more facilities are adding connected monitoring systems, which can expand both equipment sales and service opportunities.
MSA’s strategy fits that backdrop. The company has been focusing on categories where performance matters more than price alone, especially detection and fire service. Those are attractive areas because customers often prefer proven products, training support, and compatibility with existing systems. This tends to create switching friction and gives established brands an advantage.
Revenue growth has cooled from the very strong pace seen in 2023, but it remains positive again after a softer period in 2024. That suggests the company is no longer in a post-surge normalization phase to the same extent and is back to more typical expansion, helped by product demand and order activity rather than one-off comparisons.
Cash generation has also recovered well from the dip seen during the integration and working-capital pressure period. Free cash flow is now comfortably positive and remains solid in absolute terms, which is important because it gives the company room for dividends, debt reduction, bolt-on acquisitions, and product investment.
A meaningful catalyst has been MSA’s continuing push into detection and connected safety. Industrial and commercial customers increasingly want fixed monitoring systems that are integrated into plant operations and compliance processes. That trend can support both higher-value hardware sales and a larger installed base that generates follow-on business.
Another growth driver is the fire service market, where many departments continue to modernize breathing apparatus and protective gear. Because this equipment is essential and heavily specified, replacement demand can be durable even if procurement cycles are uneven from quarter to quarter.
Recent company communications have also highlighted ongoing product launches and efforts to improve manufacturing and supply-chain execution. Those initiatives matter because in a specialized safety market, growth does not only come from selling more units; it also comes from mix improvement, premium features, and reliable delivery in categories where customers prioritize performance.
Risks
This article is for informational purposes only and does not constitute financial advice. Some content is AI-generated. See Disclaimer


