Stock Analysis · BlackRock Health Sciences Trust II (BMEZ)
Overview
BlackRock Health Sciences Trust II is not an operating healthcare company. It is a closed-end fund managed by BlackRock that invests mainly in healthcare and life sciences businesses, with an added focus on private or late-stage growth opportunities. In simple terms, it gives shareholders exposure to a portfolio of biotech, pharmaceutical, medical technology, and healthcare services companies through one listed vehicle.
That structure matters for long-term analysis. The fund’s results do not depend on selling products or running hospitals. They depend mostly on how the underlying portfolio performs, how well the managers allocate capital, and whether the market values the fund at a discount or premium to its net assets.
Its economic engine is therefore different from a normal corporation. Public filings show that income comes primarily from investment activity rather than traditional business operations.
- Net realized and unrealized gains on investments: typically the largest driver over time when healthcare holdings rise in value. This source can swing sharply from positive to negative depending on markets.
- Dividend income from portfolio holdings: cash distributions received from companies held in the fund, usually a smaller contributor because many biotech and growth-oriented healthcare names pay little or no dividend.
- Interest income and other investment income: income from cash, short-term instruments, convertibles, or other portfolio-related sources.
Because BMEZ is a fund, percentages by revenue line are not stable in the same way they would be for an industrial business. In strong years, investment gains can account for the clear majority of total return generation; in weak years, they can turn negative and overwhelm ordinary income. That makes portfolio quality and sector selection more important than a simple sales breakdown.
The recent financial flow also shows this pattern clearly: results were strong in 2021, deeply negative in 2022 during the healthcare and biotech downturn, then recovered in 2023 and 2024 as portfolio values improved and expenses stayed comparatively contained.
The financial flow highlights a business model with very low balance-sheet leverage and modest operating costs, but highly variable earnings because portfolio valuations move with the market. The rebound after 2022 suggests that performance is tied much more to asset prices than to any fixed operating trend.
Key Figures
| Metric | Value | Sector ⓘ |
|---|---|---|
| Date | Oct 23, 2026 | |
| Context | ||
| Sector | Financial Services | |
| Industry | Asset Management | |
| Market Cap ⓘ | $1.05B | |
| Beta ⓘ | N/A | |
Value (Cheapness) | ||
| P/E Ratio ⓘ | 4.95 | 12.46 |
| P/B Ratio ⓘ | 0.29 | 1.25 |
| FCF Yield ⓘ | 6.70% | 9.82% |
| Dividend Yield ⓘ | N/A | 2.94% |
| EBIT / EV ⓘ | N/A | 8.11% |
| PEG ⓘ | N/A | |
Growth (Business expansion) | ||
| Revenue Growth ⓘ | N/A | 9.10% |
| RPS Growth (5Y CAGR) ⓘ | 149.97% | 12.31% |
| EPS Growth (5Y CAGR) ⓘ | N/A | -6.97% |
| BVPS Growth (5Y CAGR) ⓘ | 21.24% | 5.02% |
| Margin Growth (5Y Trend) ⓘ | 2.31% | -4.00% |
| FCF Growth (5Y CAGR) ⓘ | -11.57% | 4.71% |
| DPS Growth (5Y CAGR) ⓘ | 33.21% | 8.92% |
Quality (Business durability) | ||
| ROIC (Latest) ⓘ | N/A | 9.18% |
| ROE (Latest) ⓘ | 6.37% | 13.93% |
| ROA (Latest) ⓘ | 6.29% | 1.57% |
| ROIC (5Y Median) ⓘ | 0.54% | 7.80% |
| ROE (5Y Median) ⓘ | 3.37% | 12.15% |
| ROA (5Y Median) ⓘ | 3.42% | 1.28% |
| Net Debt / EBIT (Latest) ⓘ | N/A | 1.02 |
| Net Debt / EBIT (5Y Median) ⓘ | -0.00 | 0.72 |
| Net Debt / EBITDA (Latest) ⓘ | -0.00 | 0.88 |
| Operating Margin (Latest) ⓘ | N/A | 22.30% |
| Operating Margin (5Y Median) ⓘ | 102.15% | 24.50% |
| Debt to Equity (Latest) ⓘ | 0.04% | 59.34% |
| Profit Margin (Latest) ⓘ | N/A | 26.42% |
| Free Cash Flow (Latest) ⓘ | $70.29M | |
Momentum (Price trend) | ||
| 3Y Return ⓘ | +72.33% | +95.73% |
| 12M Return (excl. last month) ⓘ | +28.21% | +17.30% |
| 6M Return ⓘ | +21.47% | +6.07% |
| Price vs. 200-Day MA ⓘ | +13.86% | +5.36% |
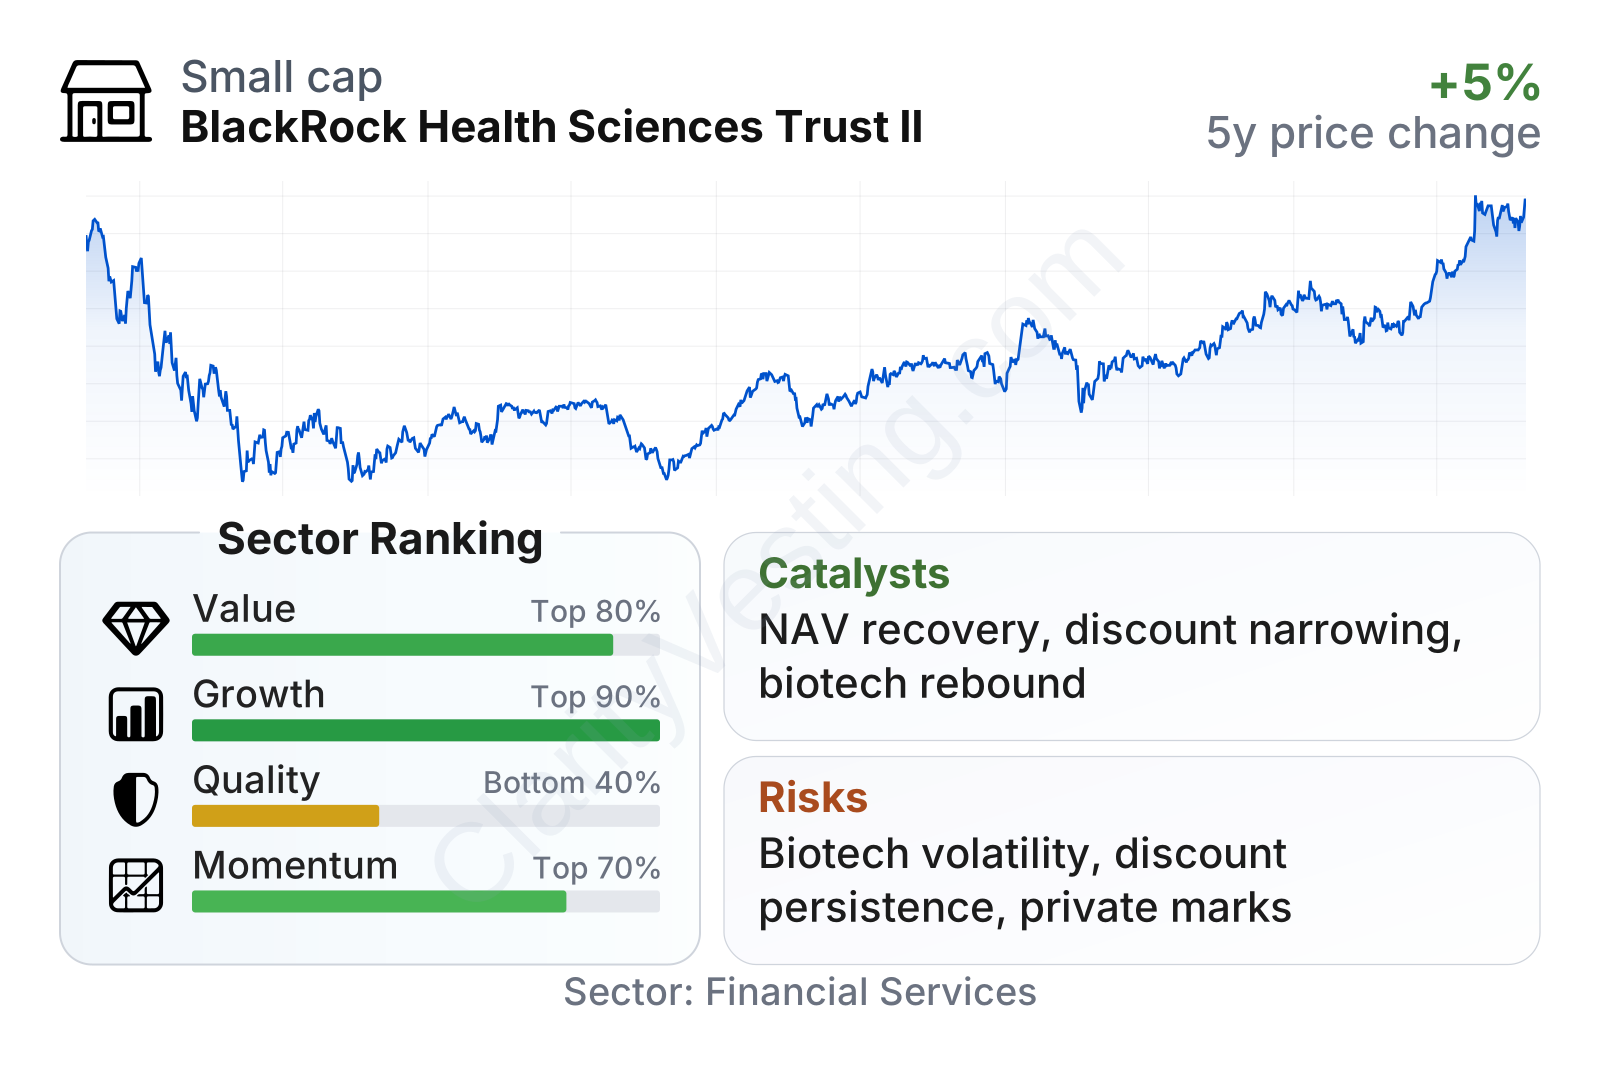
BMEZ sits in the small-to-mid-size range among listed funds, with a market value around $1 billion. The table points to an unusual mix: very strong growth and decent momentum, but weaker quality measures relative to the broader Financial Services sector. That mismatch is not surprising for a closed-end fund. Standard profitability ratios often look less informative here than balance-sheet strength, asset value growth, and price-to-book.
The value profile looks striking. The price-to-earnings ratio and especially the price-to-book ratio are far below sector medians, which suggests the market is valuing the fund at a steep discount compared with many asset-management peers. At the same time, leverage appears minimal, with debt-to-equity close to zero, which reduces financial strain.
Momentum has improved meaningfully. The share price has recovered strongly from the 2022 lows and recent medium-term returns have outpaced the sector median. Even so, the longer path has been volatile, which is typical for a vehicle exposed to biotech and other innovation-heavy healthcare segments.
Growth
The healthcare sector remains one of the most structurally attractive parts of the market for long-term capital. Aging populations, rising chronic disease burden, demand for new therapies, medical devices, diagnostics, and innovation in oncology and immunology all support long-duration spending growth. Within that broad theme, BMEZ has positioned itself to reach beyond established pharmaceutical companies into more innovative parts of the health sciences ecosystem.
That strategy can make sense over time because it combines public-market healthcare exposure with access to less liquid companies that may eventually be acquired, go public, or mature into larger commercial businesses. If execution is strong, that creates a path to growth that is different from a plain healthcare index product.
The earnings pattern shown here should be read carefully. For a fund like BMEZ, EPS can be heavily distorted by unrealized gains and losses, especially during large market swings. The sharp weakness in 2021-2022 reflected the sector selloff more than a collapse in an operating business. For long-term analysis, changes in portfolio value and net asset value tend to matter more than a single year’s EPS print.
Book value per share has trended upward strongly over the multi-year period shown, including a clear recovery after the earlier drawdown. That is an important positive sign for this type of vehicle because book value is a closer proxy for the underlying portfolio than revenue or operating income would be for a normal company.
Recent developments in healthcare innovation also create potential tailwinds. The sector continues to attract attention around obesity treatments, precision medicine, immunology, oncology, and next-generation medical technologies. A fund with the flexibility to invest across both public and private health sciences assets can benefit if capital markets reopen more fully for biotech listings and strategic acquisitions.
Another potential catalyst is valuation normalization. Closed-end funds often trade at discounts to their net asset value, but if portfolio performance remains solid, distribution policy stays supportive, or buyback activity reduces the discount, shareholder returns can improve even without dramatic changes in the underlying holdings.
Risks
This article is for informational purposes only and does not constitute financial advice. Some content is AI-generated. See Disclaimer


