Stock Analysis · Morgan Stanley (MS)
Overview
Morgan Stanley is a large global financial institution focused on advising companies and governments, managing money for wealthy clients and institutions, and operating a major Wall Street trading and investment banking platform. In simple terms, it makes money by helping clients invest, trade, raise capital, complete deals, and manage wealth.
The company’s business mix has become more balanced over time. Historically, Morgan Stanley was known mainly for investment banking and trading, but in recent years it has built a much larger wealth and asset management platform. That matters for long-term analysis because fee-based businesses can be steadier than dealmaking and trading alone.
Based on the company’s recent reporting structure, the main sources of revenue are approximately:
- Institutional Securities: about 50% to 55% — advisory on mergers and acquisitions, equity and debt underwriting, fixed income trading, equity trading, and lending activities tied to corporate and institutional clients.
- Wealth Management: about 35% to 40% — financial advice, brokerage, workplace financial services, lending to affluent clients, and asset-based fees on client accounts.
- Investment Management: about 10% to 15% — asset management for institutions and individuals across equities, fixed income, alternatives, and related investment products.
This mix is one of the key points to understand about Morgan Stanley today: it is no longer only a market-sensitive investment bank. It is also a large-scale wealth manager with recurring fee revenue and a sizable asset management operation.
Over the last several years, total revenue and net income have generally trended upward, although results can still move with market activity and capital markets conditions. Operating income recovered strongly after the softer 2022–2023 period, showing how earnings power can rebound when markets, wealth fees, and deal activity improve.
The broad pattern shows a business that has expanded meaningfully since 2021, with revenue reaching a much higher level by 2025 and profitability recovering after the 2023 slowdown. Expenses have also risen, so the key long-term question is not only growth, but how much of that growth turns into durable returns.
Key Figures
| Metric | Value | Sector ⓘ |
|---|---|---|
| Date | Oct 19, 2026 | |
| Context | ||
| Sector | Financial Services | |
| Industry | Capital Markets | |
| Market Cap ⓘ | $283.60B | |
| Beta ⓘ | 1.21 | |
Value (Cheapness) | ||
| P/E Ratio ⓘ | 14.32 | 12.26 |
| P/B Ratio ⓘ | 2.73 | 1.23 |
| FCF Yield ⓘ | -5.53% | 10.40% |
| Dividend Yield ⓘ | 2.36% | 3.02% |
| EBIT / EV ⓘ | 14.75% | 8.14% |
| PEG ⓘ | 1.76 | |
Growth (Business expansion) | ||
| Revenue Growth ⓘ | 10.80% | 9.25% |
| RPS Growth (5Y CAGR) ⓘ | 22.69% | 12.19% |
| EPS Growth (5Y CAGR) ⓘ | 12.54% | -9.36% |
| BVPS Growth (5Y CAGR) ⓘ | 4.83% | 4.99% |
| Margin Growth (5Y Trend) ⓘ | -14.95% | -3.86% |
| FCF Growth (5Y CAGR) ⓘ | N/A | 4.81% |
| DPS Growth (5Y CAGR) ⓘ | 15.83% | 8.79% |
Quality (Business durability) | ||
| ROIC (Latest) ⓘ | 4.17% | 9.49% |
| ROE (Latest) ⓘ | 18.26% | 13.87% |
| ROA (Latest) ⓘ | 1.32% | 1.54% |
| ROIC (5Y Median) ⓘ | 3.51% | 7.86% |
| ROE (5Y Median) ⓘ | 12.69% | 12.17% |
| ROA (5Y Median) ⓘ | 1.11% | 1.30% |
| Net Debt / EBIT (Latest) ⓘ | 13.94 | 0.99 |
| Net Debt / EBIT (5Y Median) ⓘ | 16.18 | 0.73 |
| Net Debt / EBITDA (Latest) ⓘ | 11.93 | 0.91 |
| Operating Margin (Latest) ⓘ | 20.66% | 22.30% |
| Operating Margin (5Y Median) ⓘ | 19.09% | 24.63% |
| Debt to Equity (Latest) ⓘ | 475.09% | 58.04% |
| Profit Margin (Latest) ⓘ | 25.63% | 26.57% |
| Free Cash Flow (Latest) ⓘ | -$15.68B | |
Momentum (Price trend) | ||
| 3Y Return ⓘ | +146.42% | +88.26% |
| 12M Return (excl. last month) ⓘ | +32.86% | +19.24% |
| 6M Return ⓘ | -2.55% | +4.70% |
| Price vs. 200-Day MA ⓘ | -6.48% | +3.66% |
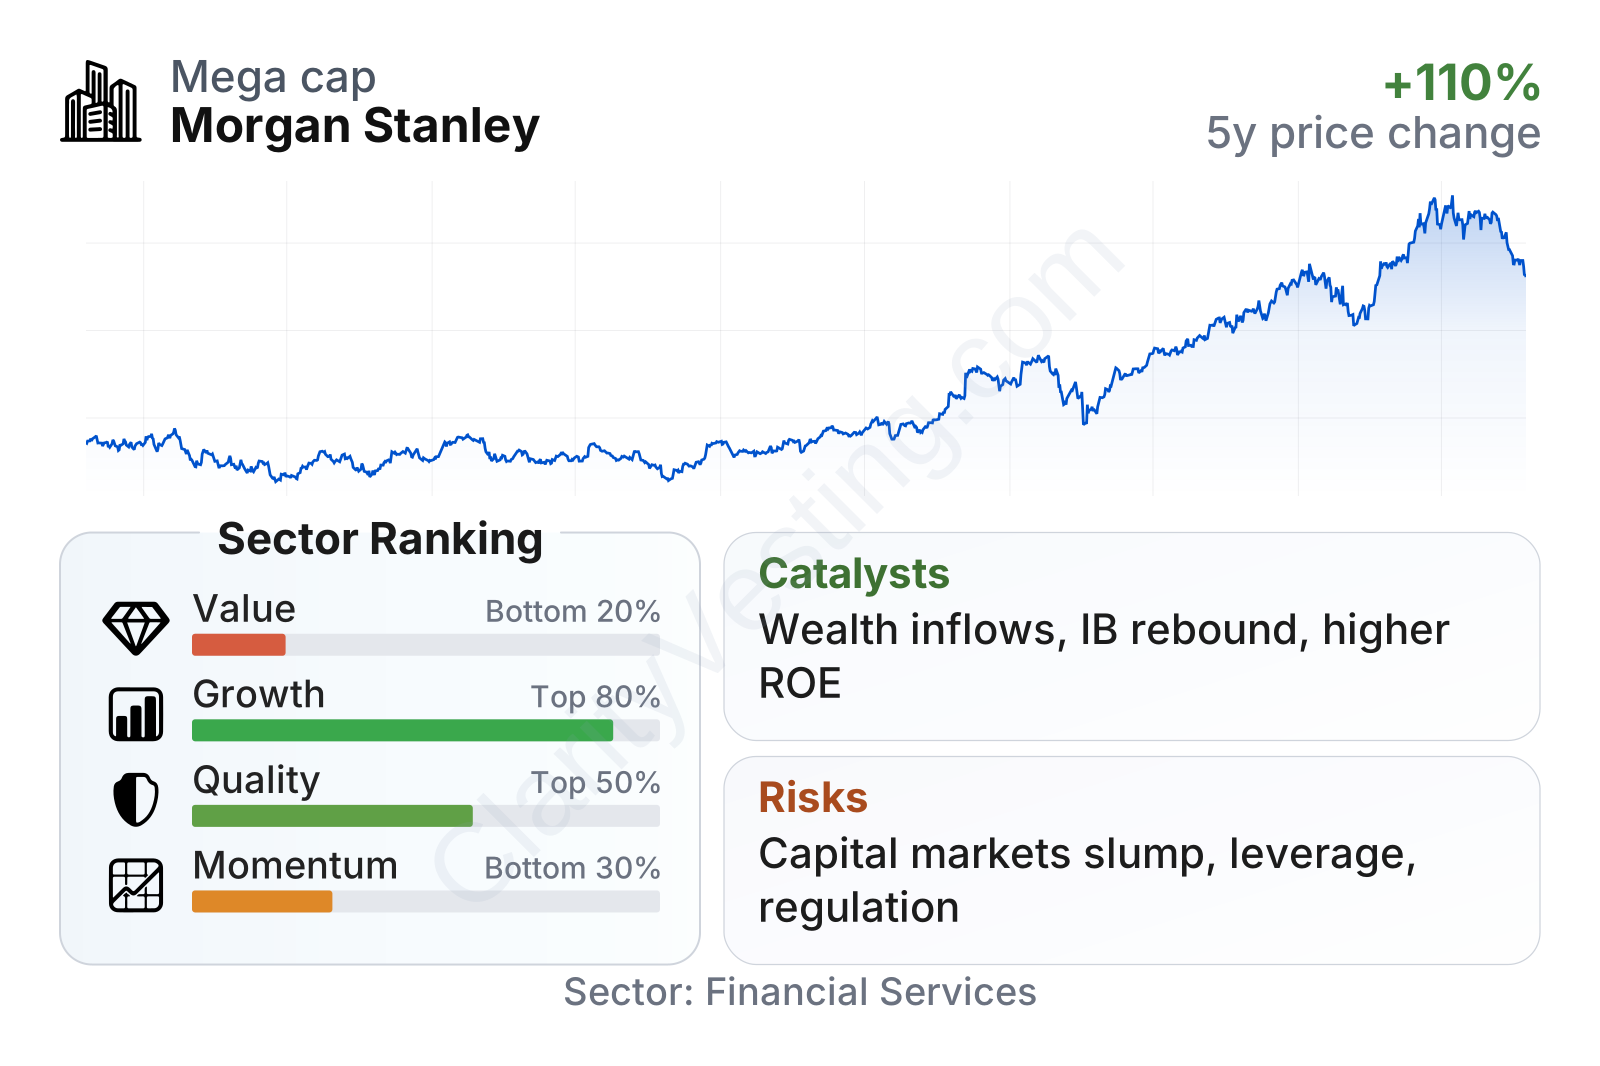
Morgan Stanley is one of the larger companies in U.S. financial services, with a market value in the hundreds of billions of dollars. The stock has had a strong multi-year advance, even though the last six months have been softer and the shares currently sit below their 200-day average, which points to weaker recent momentum after a powerful run.
In the factor breakdown, growth looks better than much of the sector, while quality is around the upper middle of the pack. Value looks less attractive: the earnings multiple is somewhat above the sector median, and the price-to-book ratio is far above the sector median. The dividend yield is also lower than many financial peers, partly because the stock price has risen so much. One figure that deserves caution is free cash flow, which appears negative, but that measure is less straightforward for large banks and broker-dealers than it is for industrial or software companies.
Growth
Morgan Stanley operates in areas with solid long-term demand drivers. Global wealth creation, retirement planning, growth in managed assets, alternative investments, and corporations’ ongoing need for capital markets access all support the company’s core activities. Financial markets are cyclical, but the broader sector is not disappearing; it is evolving toward larger, diversified platforms with strong advisory, scale, and client relationships.
The company’s strategy for future growth is coherent. Management has spent years shifting the business toward wealth and investment management, especially through the E*TRADE and Eaton Vance acquisitions. That makes the revenue base broader and potentially more resilient than a pure investment bank. A larger pool of client assets can support fee income, lending, cross-selling, and cash management over time.
Another important catalyst is a recovery in capital markets activity. When merger volumes, IPOs, debt issuance, and sponsor activity improve, Morgan Stanley’s Institutional Securities segment can benefit materially. At the same time, stronger equity markets often lift fee-based asset levels in wealth and investment management.
Earnings per share show the cyclical profile clearly: a decline from the 2021 peak into 2023, followed by a strong rebound in 2024 and 2025, with 2026 remaining on an elevated path. That pattern suggests Morgan Stanley still has meaningful operating leverage to better market conditions.
Book value per share has also moved steadily higher over the last five years, rising from the high-$50s to the upper-$60s. That is an encouraging sign because book value is a core anchor for financial institutions; steady growth here suggests the company has continued to build underlying equity even while earnings moved through a cycle.
Recent company updates have also pointed to continued strength in wealth management asset gathering and better conditions in investment banking compared with the more difficult environment seen earlier in the cycle. For Morgan Stanley, a combination of rising client assets, healthier dealmaking, and normalization in underwriting activity represents the clearest growth opportunity over the next few years.
Risks
This article is for informational purposes only and does not constitute financial advice. Some content is AI-generated. See Disclaimer


