Stock Analysis · Marsh & McLennan Companies Inc (MRSH)
Overview
Marsh & McLennan Companies, now widely branded as Marsh McLennan, is a professional services group focused on risk, insurance, strategy, and people-related consulting. In simple terms, it helps companies and institutions understand risk, buy insurance, manage employee benefits, improve operations, and plan strategy. Its business is not based on taking large insurance underwriting risk like an insurer; instead, it mainly earns fees and commissions for advice, brokerage, and consulting services.
The company operates through two main segments: Risk and Insurance Services and Consulting. Risk and Insurance Services includes Marsh, one of the world’s largest insurance brokers, and Guy Carpenter, a major reinsurance broker. Consulting includes Mercer, which focuses on health, wealth, retirement, and talent, and Oliver Wyman, which provides management consulting.
Based on recent annual reporting, revenue is broadly concentrated as follows:
- Insurance brokerage and risk services: about 70% to 75% of total revenue. This mainly includes commercial insurance brokerage, reinsurance brokerage, risk advisory, and related services through Marsh and Guy Carpenter.
- Consulting: about 25% to 30% of total revenue. This includes health, wealth, retirement, talent advisory, and strategy and operations consulting through Mercer and Oliver Wyman.
Within those categories, Marsh is the largest earnings engine, while Mercer is also a major contributor. This mix matters because brokerage tends to be recurring and resilient, while consulting adds another path for expansion when clients face regulatory, workforce, healthcare, cyber, climate, or strategic change needs.
Over the last several years, the business has shown a clear pattern of expanding revenue, operating income, and net income. Revenue moved from roughly $20 billion in 2021 to nearly $27 billion in 2025, while profitability also advanced, suggesting that growth has not relied only on acquisitions.
The long-term picture shows a steadily larger business with improving profit dollars, although interest expense has also climbed, reflecting a heavier financing burden than earlier in the period.
Key Figures
| Metric | Value | Sector ⓘ |
|---|---|---|
| Date | Oct 19, 2026 | |
| Context | ||
| Sector | Financial Services | |
| Industry | Insurance Brokers | |
| Market Cap ⓘ | $89.88B | |
| Beta ⓘ | 0.58 | |
Value (Cheapness) | ||
| P/E Ratio ⓘ | 22.53 | 12.26 |
| P/B Ratio ⓘ | 6.15 | 1.23 |
| FCF Yield ⓘ | 4.62% | 10.40% |
| Dividend Yield ⓘ | 0.48% | 3.02% |
| EBIT / EV ⓘ | 4.32% | 8.14% |
| PEG ⓘ | 1.50 | |
Growth (Business expansion) | ||
| Revenue Growth ⓘ | 8.10% | 9.25% |
| RPS Growth (5Y CAGR) ⓘ | 9.26% | 12.19% |
| EPS Growth (5Y CAGR) ⓘ | 5.23% | -9.36% |
| BVPS Growth (5Y CAGR) ⓘ | 9.08% | 4.99% |
| Margin Growth (5Y Trend) ⓘ | 0.56% | -3.86% |
| FCF Growth (5Y CAGR) ⓘ | 12.61% | 4.81% |
| DPS Growth (5Y CAGR) ⓘ | 14.75% | 8.79% |
Quality (Business durability) | ||
| ROIC (Latest) ⓘ | 11.00% | 9.49% |
| ROE (Latest) ⓘ | 27.34% | 13.87% |
| ROA (Latest) ⓘ | 6.82% | 1.54% |
| ROIC (5Y Median) ⓘ | N/A | 7.86% |
| ROE (5Y Median) ⓘ | 31.25% | 12.17% |
| ROA (5Y Median) ⓘ | 7.77% | 1.30% |
| Net Debt / EBIT (Latest) ⓘ | 4.02 | 0.99 |
| Net Debt / EBIT (5Y Median) ⓘ | 2.64 | 0.73 |
| Net Debt / EBITDA (Latest) ⓘ | 3.41 | 0.91 |
| Operating Margin (Latest) ⓘ | 17.92% | 22.30% |
| Operating Margin (5Y Median) ⓘ | 24.04% | 24.63% |
| Debt to Equity (Latest) ⓘ | 152.18% | 58.04% |
| Profit Margin (Latest) ⓘ | 14.20% | 26.57% |
| Free Cash Flow (Latest) ⓘ | $4.15B | |
Momentum (Price trend) | ||
| 3Y Return ⓘ | +3.93% | +88.26% |
| 12M Return (excl. last month) ⓘ | -8.35% | +19.24% |
| 6M Return ⓘ | +4.35% | +4.70% |
| Price vs. 200-Day MA ⓘ | +7.83% | +3.66% |
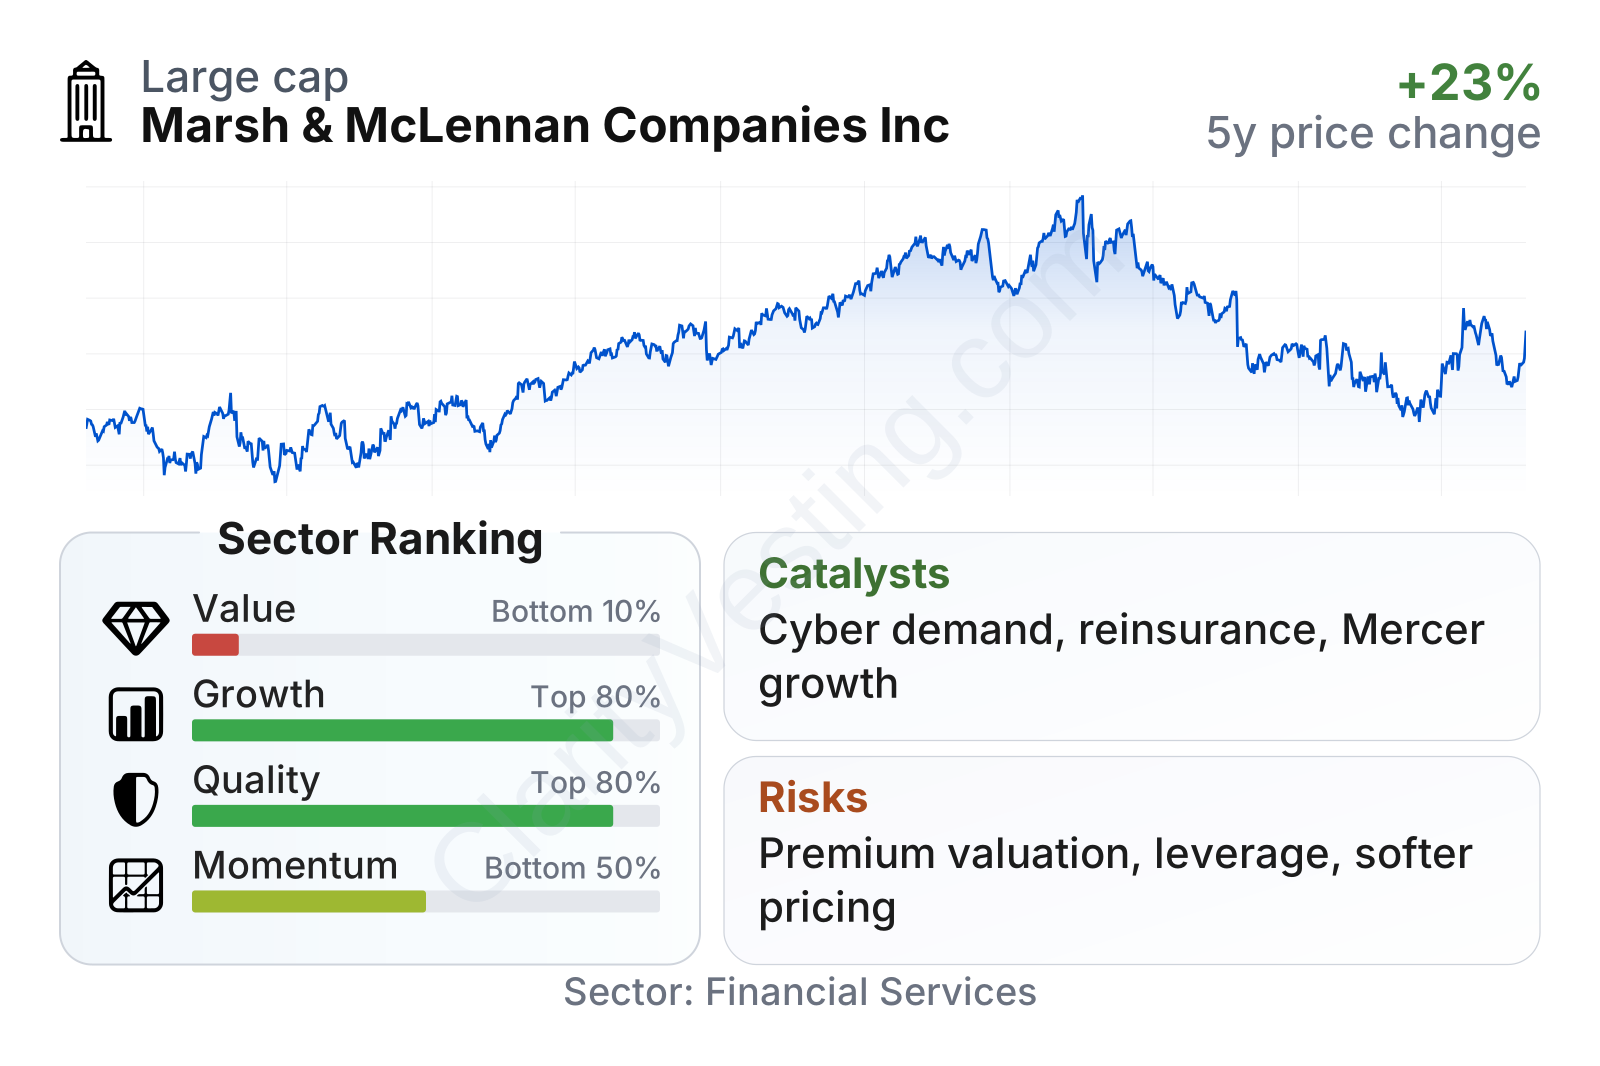
Marsh McLennan stands out as a very large company with relatively low share-price volatility, as shown by its beta below 1. On operating quality and growth measures, it ranks well versus much of the financial sector, especially on returns on capital, cash generation growth, and dividend growth. The weaker area is valuation: earnings, book value, cash flow, and dividend measures all point to a stock trading at a clear premium to sector norms. Price momentum has also been less impressive than many financial peers over the last year and over a multiyear period.
Growth
Marsh McLennan operates in areas that benefit from durable, long-range demand. Insurance brokerage tends to grow as insured values rise, regulations become more complex, and clients need more specialized advice. Reinsurance brokerage can benefit when catastrophe losses, climate-related volatility, and capacity shifts make risk transfer more complicated. Consulting demand is supported by healthcare cost pressure, retirement planning needs, talent management, digital transformation, and strategy work for large organizations. None of these themes look short-lived.
The company’s strategy is coherent for this environment. It combines scale in insurance brokerage with consulting franchises that are hard to replicate globally. This gives it multiple ways to grow: organic expansion, cross-selling between divisions, selective acquisitions, and ongoing pricing support in complex insurance markets. It also has significant exposure to areas with structural tailwinds such as cyber risk, climate and resilience advisory, health and benefits outsourcing, and reinsurance placement.
Earnings per share have moved up strongly over the last five full years, rising from a little above $6 in 2021 to nearly $10 in 2025. That trajectory suggests the company has been translating revenue growth into per-share profit growth rather than simply becoming bigger in absolute terms.
Book value per share has also trended upward after a dip in 2022, which supports the idea that balance-sheet value has been compounding over time. In the broader growth profile, revenue per share has increased at a high-single-digit annual pace over five years, while free cash flow has grown even faster, which is an encouraging combination for a fee-based business.
A meaningful recent opportunity is the continued need for risk advisory around cyber threats, supply-chain disruption, climate exposure, and catastrophic events. Another is health and wealth consulting, where employers continue to outsource increasingly complex benefits and workforce decisions. Public company updates during 2026 also indicate continued emphasis on acquisitions and specialty capabilities, which fits the company’s long-running expansion model.
Risks
This article is for informational purposes only and does not constitute financial advice. Some content is AI-generated. See Disclaimer


