Stock Analysis · Millrose Properties Inc (MRP)
Overview
Millrose Properties Inc is a residential real estate investment trust, or REIT. In simple terms, a REIT owns and manages real estate assets and passes through much of its income to shareholders through dividends. Millrose focuses on residential-related property assets, and its recent financial profile suggests a business that only recently began generating meaningful operating revenue at scale.
Based on the latest available annual figures, the company’s revenue appears to come primarily from property-related operating income within residential real estate. The public financial statements available for the recent period do not provide a broad mix of business lines, which suggests a fairly concentrated model rather than a diversified platform spanning many unrelated activities.
Using the latest annual breakdown, the main revenue and profit structure can be summarized as follows:
- Property-related revenue: approximately 100% of reported revenue in the latest full year. This is the core economic engine of the business.
- Direct property-level costs: approximately 15% of revenue, indicating a relatively high gross margin structure for the latest period.
- Selling, general and administrative expense: approximately 4% of revenue, showing limited overhead relative to revenue once the business became operational at scale.
- Interest expense: approximately 15% of revenue, which matters because REITs often rely on debt to finance assets.
The biggest recent shift is not a small improvement but a change in operating profile: the company moved from essentially no reported revenue in earlier periods to several hundred million dollars in revenue and solid net income in 2025. That makes Millrose less of a mature steady-state REIT and more of a company that has recently entered a new phase.
The operating flow shows a major break between earlier loss-making periods with little or no revenue and the latest year, when revenue, operating income, and net income turned clearly positive. That sharp change is the most important financial pattern to understand before judging the business.
Key Figures
| Metric | Value | Sector ⓘ |
|---|---|---|
| Date | Oct 17, 2026 | |
| Context | ||
| Sector | Real Estate | |
| Industry | REIT - Residential | |
| Market Cap ⓘ | $3.52B | |
| Beta ⓘ | N/A | |
Value (Cheapness) | ||
| P/E Ratio ⓘ | 7.39 | 17.38 |
| P/B Ratio ⓘ | 0.63 | 0.85 |
| FCF Yield ⓘ | 148.31% | 7.38% |
| Dividend Yield ⓘ | 13.44% | 4.85% |
| EBIT / EV ⓘ | 9.47% | 3.78% |
| PEG ⓘ | N/A | |
Growth (Business expansion) | ||
| Revenue Growth ⓘ | 32.10% | 5.30% |
| RPS Growth (5Y CAGR) ⓘ | N/A | 6.02% |
| EPS Growth (5Y CAGR) ⓘ | N/A | -11.37% |
| BVPS Growth (5Y CAGR) ⓘ | -14.53% | 0.45% |
| Margin Growth (5Y Trend) ⓘ | N/A | -0.22% |
| FCF Growth (5Y CAGR) ⓘ | N/A | 5.40% |
| DPS Growth (5Y CAGR) ⓘ | N/A | 5.02% |
Quality (Business durability) | ||
| ROIC (Latest) ⓘ | N/A | 5.69% |
| ROE (Latest) ⓘ | 8.13% | 7.56% |
| ROA (Latest) ⓘ | 5.08% | 2.85% |
| ROIC (5Y Median) ⓘ | N/A | 4.22% |
| ROE (5Y Median) ⓘ | -3.47% | 6.03% |
| ROA (5Y Median) ⓘ | -3.29% | 2.44% |
| Net Debt / EBIT (Latest) ⓘ | 3.74 | 7.59 |
| Net Debt / EBIT (5Y Median) ⓘ | N/A | 8.40 |
| Net Debt / EBITDA (Latest) ⓘ | 3.66 | 5.27 |
| Net Debt / Assets ⓘ | 25.18% | 37.76% |
| EBITDA / Interest ⓘ | 4.23 | 4.10 |
| Operating Margin (Latest) ⓘ | 85.87% | 35.29% |
| Operating Margin (5Y Median) ⓘ | N/A | 37.31% |
| Debt to Equity (Latest) ⓘ | 42.36% | 88.87% |
| Profit Margin (Latest) ⓘ | 62.60% | 19.61% |
| Free Cash Flow (Latest) ⓘ | $5.23B | |
Momentum (Price trend) | ||
| 3Y Return ⓘ | N/A | +30.75% |
| 12M Return (excl. last month) ⓘ | -7.47% | +4.36% |
| 6M Return ⓘ | -22.56% | -2.52% |
| Price vs. 200-Day MA ⓘ | -18.99% | -2.34% |
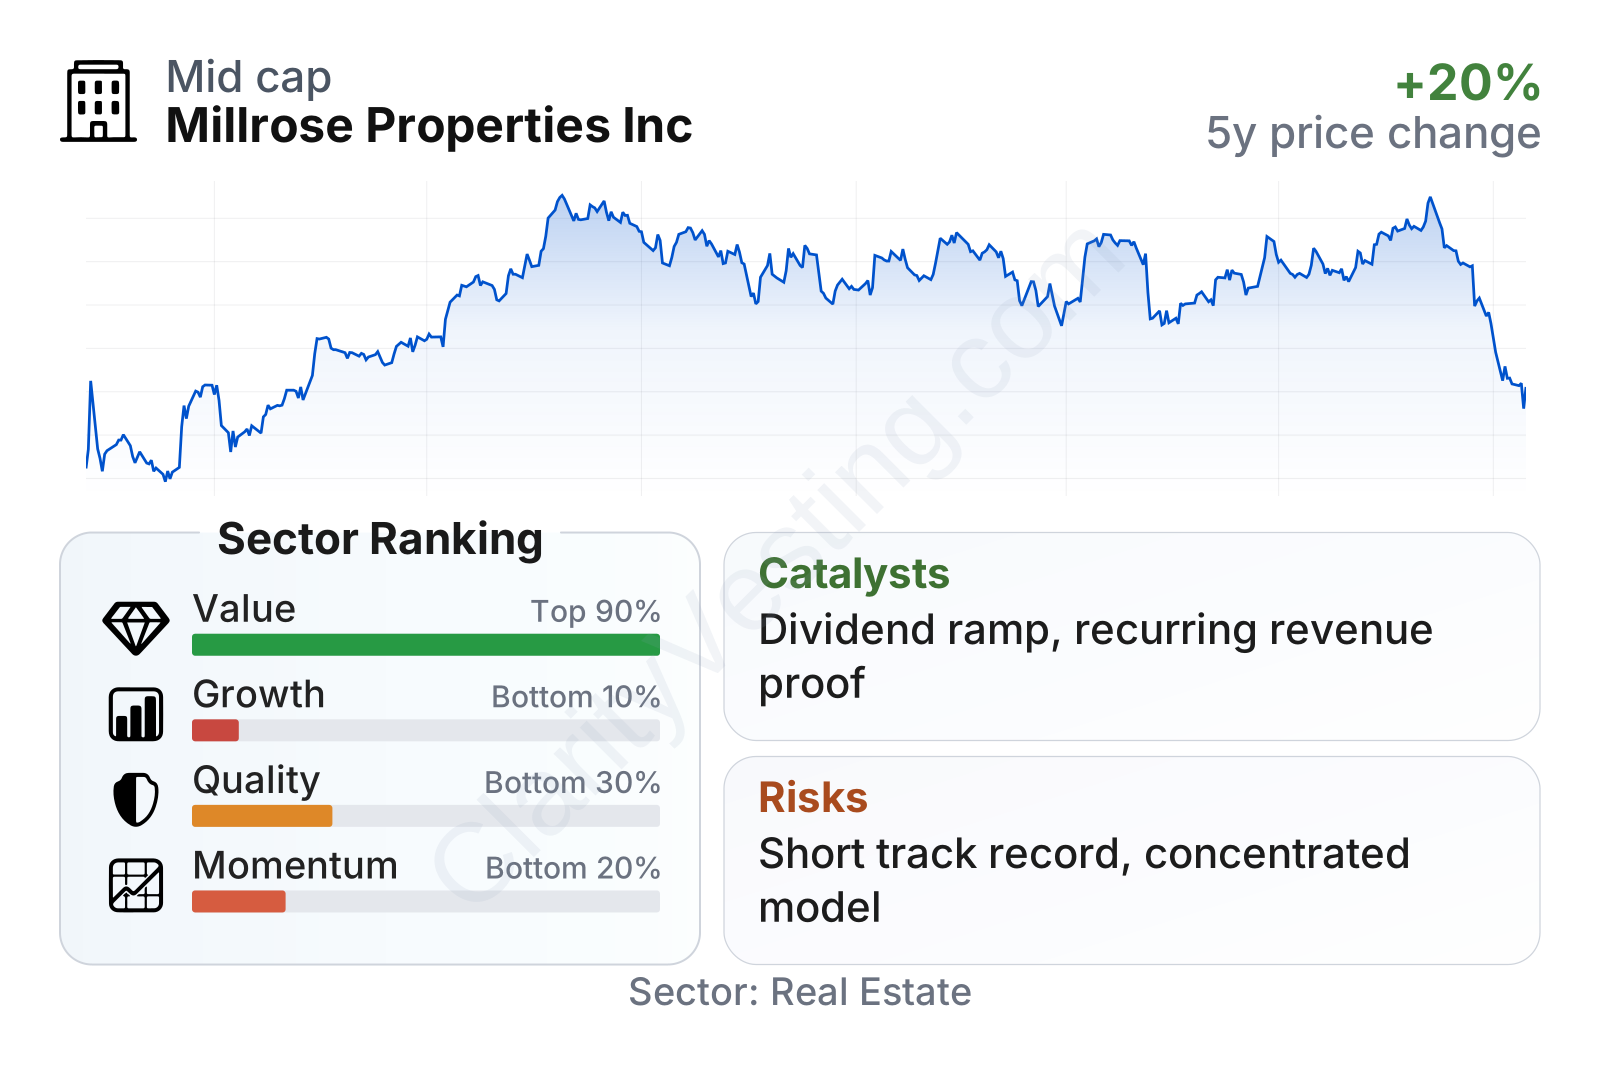
Millrose is a mid-sized real estate company by market value. The most striking features in the current metrics are a low earnings multiple compared with the sector median, a price-to-book ratio below the sector median, and a dividend yield that is much higher than the typical residential REIT. On profitability, return on assets and return on equity are currently above sector medians, while leverage looks more restrained than many peers based on debt-to-equity and net debt to EBITDA.
At the same time, the broader factor picture is mixed. The company ranks well on value, but much lower on growth, quality, and momentum relative to the sector. That combination usually means the market is recognizing the income and asset backing, but still has doubts about how durable the recent improvement is.
Growth
Residential real estate remains a structurally important segment, supported over the long run by housing demand, demographic needs, and the role of rental and housing-related assets in the broader economy. That said, this is not a high-growth technology market. Growth in this sector usually comes from disciplined asset acquisition, redevelopment, rent or fee increases, financing efficiency, and good capital allocation.
For Millrose, the growth question is less about whether housing demand exists and more about whether the company can turn its recent step-change into a repeatable operating model. The latest annual numbers show revenue growth of about 32% year over year, which is far above the sector median. However, the longer-term record is distorted by earlier years with no meaningful revenue, so the recent surge should be viewed as a transition rather than proof of a stable multi-year growth engine.
The revenue-per-share pattern reinforces that point. Rather than a smooth climb over several years, the chart points to a business that only recently began producing material revenue on a per-share basis. That can create upside if the new base holds and expands, but it also makes forecasting more uncertain than for an established REIT with a long history of steady rent growth.
The dividend profile is another visible catalyst. REITs are often judged partly on their capacity to generate and distribute cash, and Millrose’s trailing dividend yield has moved into double-digit territory, well above the sector median.
The dividend-per-share trend shows that distributions were absent in earlier periods and then jumped sharply in the latest year. That kind of rapid emergence can attract attention, especially when paired with positive net income and strong free cash flow, but the key issue for long-term analysis is whether the payout is backed by recurring property cash generation rather than by a one-time shift in corporate structure or asset base.
A meaningful near-term catalyst is therefore execution consistency. If upcoming filings continue to show recurring revenue, controlled operating costs, and stable coverage of the dividend, the company’s profile could gradually look less transitional and more comparable to established income-producing REITs.
Risks
This article is for informational purposes only and does not constitute financial advice. Some content is AI-generated. See Disclaimer


