Stock Analysis · Mercury Systems Inc (MRCY)
Overview
Mercury Systems is a U.S. aerospace and defense technology company that designs and manufactures electronic products used in mission-critical military and aerospace programs. In simple terms, it provides the processing, sensing, networking, storage, and safety-related hardware that helps defense systems collect data, move it, protect it, and act on it in real time. Its products are used in areas such as radar, electronic warfare, missiles, avionics, space payloads, and secure communications.
The company primarily serves defense prime contractors and the U.S. government. Its business model is based on supplying highly specialized components and subsystems that become part of larger platforms, rather than selling finished aircraft or weapons systems directly to end users. That gives Mercury exposure to long program cycles and recurring demand tied to modernization and sustainment budgets.
Based on the company’s recent annual filing, revenue is reported through one operating segment, but management describes demand across several product and capability areas. Exact percentages by product line are not disclosed in a way that allows a precise ranked split, yet Mercury’s revenue base can be understood through its main solution categories:
- Signal processing and computing modules: embedded processing boards, servers, and mission computers used in radar, avionics, and electronic warfare.
- RF and microwave technologies: components and subsystems that send, receive, filter, and amplify high-frequency signals for sensing and communications.
- Secure memory and data storage: products designed for harsh environments and defense-grade cybersecurity requirements.
- Safety-critical and avionics solutions: electronics used where reliability and certification matter, including airborne and other mission systems.
- Systems integration and engineering support: customization, integration, and program-specific development work tied to customer platforms.
One important feature of Mercury’s revenue mix is customer concentration by market rather than by one commercial end market: the business is overwhelmingly tied to defense and government-related programs, with the U.S. market remaining the core source of demand. That makes the company more dependent on procurement cycles and program execution than on consumer demand.
From a cost structure perspective, the business has recently shown a recovery in sales after a weak 2024, but profitability is still under pressure. Revenue for fiscal 2026 moved back near the $1 billion level, operating income turned positive, and research and development spending came down from earlier peaks. However, net income remained negative because gross profit is still relatively tight and interest expense continues to weigh on results.
The broader pattern is a business that has stabilized after a difficult period, but has not yet fully converted that stabilization into strong bottom-line earnings.
Key Figures
| Metric | Value | Sector ⓘ |
|---|---|---|
| Date | Oct 17, 2026 | |
| Context | ||
| Sector | Industrials | |
| Industry | Aerospace & Defense | |
| Market Cap ⓘ | $4.67B | |
| Beta ⓘ | 0.98 | |
Value (Cheapness) | ||
| P/E Ratio ⓘ | N/A | 22.10 |
| P/B Ratio ⓘ | 3.10 | 1.97 |
| FCF Yield ⓘ | 1.39% | 6.38% |
| Dividend Yield ⓘ | N/A | 1.94% |
| EBIT / EV ⓘ | 0.06% | 4.79% |
| PEG ⓘ | 2.79 | |
Growth (Business expansion) | ||
| Revenue Growth ⓘ | 6.10% | 9.30% |
| RPS Growth (5Y CAGR) ⓘ | -1.00% | 7.81% |
| EPS Growth (5Y CAGR) ⓘ | -20.52% | -13.06% |
| BVPS Growth (5Y CAGR) ⓘ | -1.89% | 6.14% |
| Margin Growth (5Y Trend) ⓘ | N/A | 0.88% |
| FCF Growth (5Y CAGR) ⓘ | N/A | 11.01% |
| DPS Growth (5Y CAGR) ⓘ | -56.63% | 9.48% |
Quality (Business durability) | ||
| ROIC (Latest) ⓘ | -0.43% | 10.84% |
| ROA (Latest) ⓘ | -1.24% | 5.41% |
| ROIC (5Y Median) ⓘ | -0.90% | 9.38% |
| ROA (5Y Median) ⓘ | -1.33% | 4.95% |
| Net Debt / EBIT (Latest) ⓘ | 84.50 | 2.08 |
| Net Debt / EBIT (5Y Median) ⓘ | N/A | 2.27 |
| Net Debt / EBITDA (Latest) ⓘ | 3.77 | 1.39 |
| Net Debt / Assets ⓘ | 12.34% | 19.28% |
| EBITDA / Interest ⓘ | 2.57 | 9.58 |
| Operating Margin (Latest) ⓘ | 0.34% | 10.50% |
| Operating Margin (5Y Median) ⓘ | -2.40% | 10.29% |
| Debt to Equity (Latest) ⓘ | 33.45% | 65.48% |
| Profit Margin (Latest) ⓘ | -3.02% | 6.67% |
| Free Cash Flow (Latest) ⓘ | $64.93M | |
Momentum (Price trend) | ||
| 3Y Return ⓘ | +95.94% | +61.68% |
| 12M Return (excl. last month) ⓘ | +12.17% | +12.58% |
| 6M Return ⓘ | -9.99% | 0.00% |
| Price vs. 200-Day MA ⓘ | -17.85% | +0.02% |
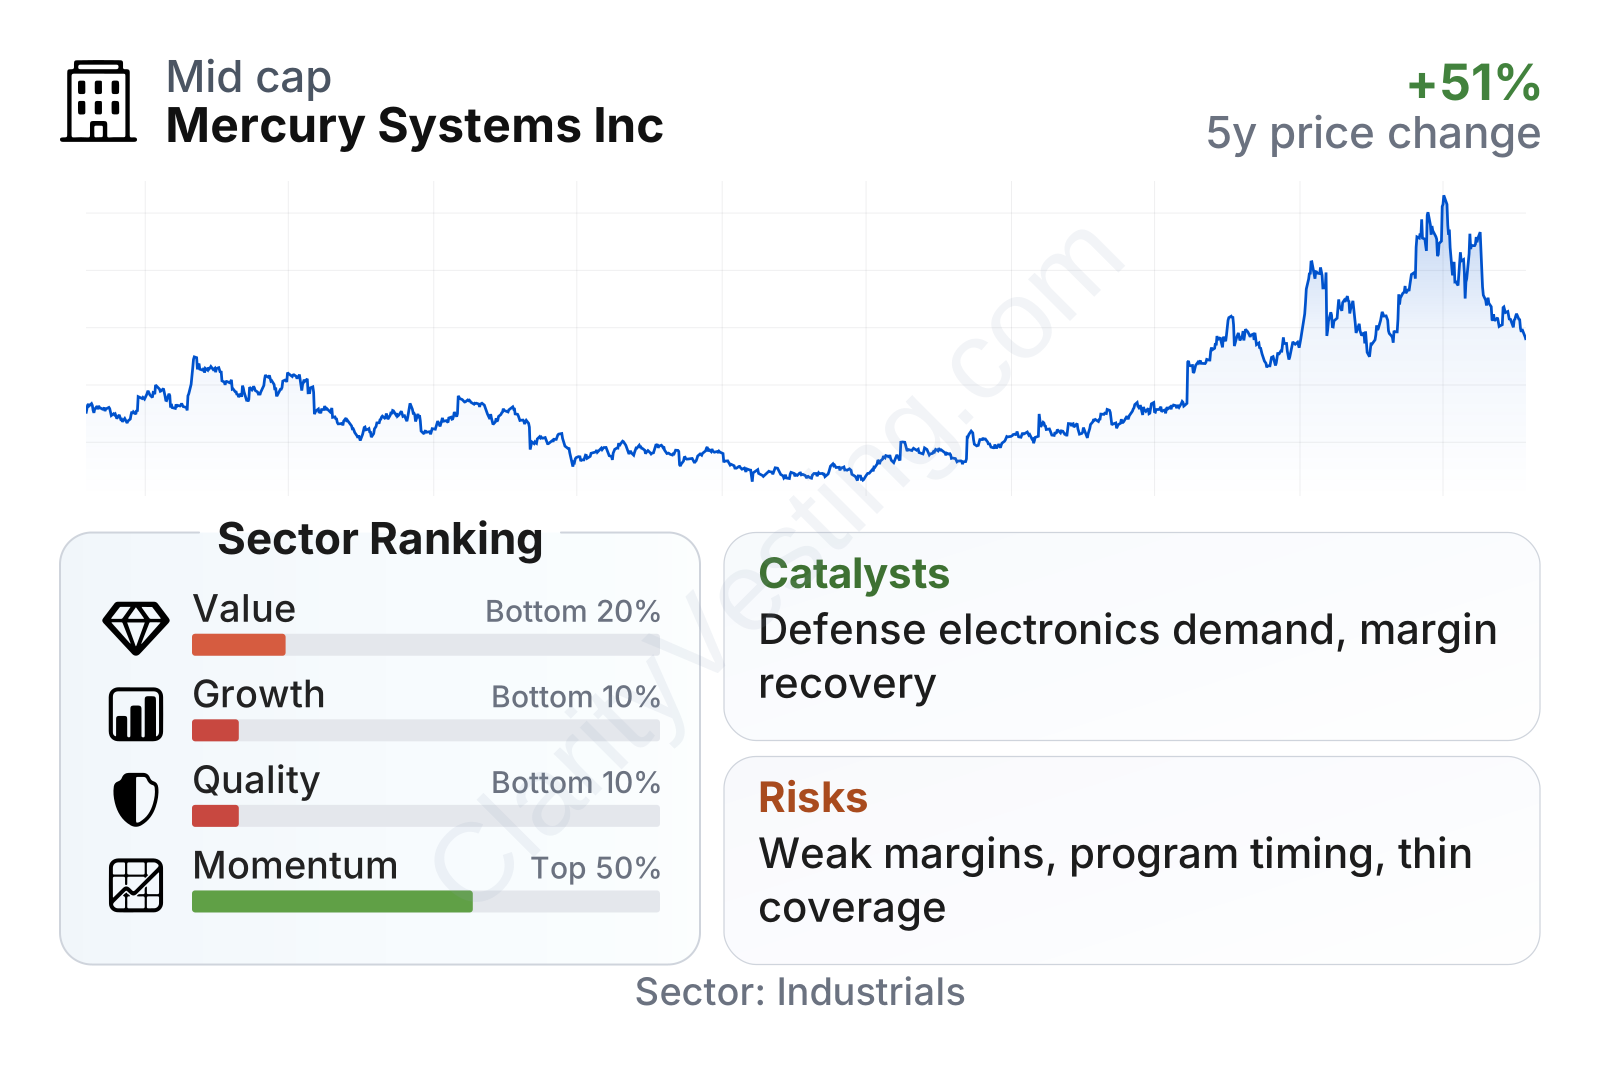
Mercury Systems is a mid-sized aerospace and defense company with a market value around $5 billion and a stock volatility close to the market average. The most notable contrast in the metrics is between share-price strength and business fundamentals. Momentum has been better than much of the sector over the last year and over three years, but value, quality, and growth rankings remain weak versus industry peers. In plain language, the market has recently become more optimistic, while the underlying financial profile still looks like a turnaround case rather than a fully healthy defense supplier.
Growth
Mercury operates in a sector with favorable long-term demand drivers. Defense electronics is supported by rising military spending in areas such as radar modernization, missile systems, electronic warfare, secure processing, and space-based capabilities. These are not short-lived themes. Modern defense platforms increasingly rely on more computing power, more sensors, more data movement, and stronger cybersecurity at the edge, which fits Mercury’s product set well.
The company’s strategy also makes sense on paper. Mercury focuses on being a specialized supplier of high-performance subsystems used inside larger defense platforms. That position can be valuable because prime contractors often prefer trusted suppliers with proven qualification records rather than redesigning critical electronics from scratch. Mercury has also spent years building a broad portfolio through internal development and acquisitions, giving it a presence across several defense electronics niches instead of relying on a single product family.
Recent revenue trends suggest the business has moved out of its weakest stretch. After several quarters of declines in 2023 and 2024, year-over-year growth turned positive again and remained positive through fiscal 2026, with recent quarterly gains generally in the mid-single-digit to low-double-digit range. That is a constructive sign, although it still trails the broader sector on a trailing basis and does not yet show the kind of sustained acceleration that would remove all doubts.
Cash generation has improved materially from the period when free cash flow was negative. Mercury produced positive trailing free cash flow again, although the level has pulled back from its peak over the last two years. For long-term analysis, that matters because a defense electronics supplier with uneven earnings can still strengthen its position if it consistently converts sales into cash and uses that cash to reduce operational strain.
A meaningful recent catalyst is the continued normalization of operations after manufacturing, execution, and margin issues that hurt prior results. Fiscal 2026 showed higher revenue, positive operating income, and lower research and development expense than in earlier years. If that operating recovery continues, the next step would be improved gross margin and better earnings conversion, which could have an outsized effect because the business has already demonstrated that even moderate sales growth can improve fixed-cost absorption.
Another growth support is exposure to long-cycle defense programs. Mercury’s products often go into systems that remain in service for many years, creating follow-on demand from upgrades, replacements, and sustainment. This does not guarantee rapid expansion, but it can support durable revenue once a product is designed into a platform.
Risks
This article is for informational purposes only and does not constitute financial advice. Some content is AI-generated. See Disclaimer


