Stock Analysis · The Mosaic Company (MOS)
Overview
The Mosaic Company is one of the largest crop nutrient producers in the world. Its products help farmers improve soil fertility and raise crop yields, mainly through phosphate and potash fertilizers. Mosaic also has a smaller business that distributes fertilizers and crop nutrition products in South America. In simple terms, the company sits near the beginning of the food supply chain: when farmers plant major crops such as corn, soybeans, and wheat, fertilizer demand is a critical input.
Mosaic’s revenue is mainly tied to fertilizer volumes sold and, even more importantly, fertilizer prices, which can move sharply from year to year. Based on the company’s recent reporting structure, revenue is primarily generated from the following areas:
- Phosphates: approximately 45% to 50% of revenue. This segment produces concentrated phosphate crop nutrients and animal feed ingredients.
- Potash: approximately 20% to 25% of revenue. Potash is a potassium-based nutrient used to improve plant health and crop quality.
- Mosaic Fertilizantes: approximately 30% to 35% of revenue. This business is centered in Brazil and includes fertilizer production, blending, imports, and distribution.
The business model is straightforward but cyclical: Mosaic extracts or processes fertilizer minerals, sells them into global agricultural markets, and benefits when crop economics support strong fertilizer application rates. The challenge is that profits can swing widely because the selling price of fertilizers often changes faster than production costs.
Over the last several years, the company’s income profile has clearly shown that cyclicality. Revenue and operating profit surged in 2022 during exceptionally strong fertilizer markets, then normalized sharply in 2023 and 2024 before partially recovering in 2025. That pattern matters because Mosaic is not a steady compounder; it is a commodity-linked business where timing in the cycle has a major effect on results.
The flow of revenue to profit highlights how dramatically margins expanded in 2022 and then compressed afterward. Even with sales recovering from the 2024 low, earnings have remained much more sensitive to pricing than to overhead costs, which reinforces how dependent the company is on fertilizer market conditions rather than on fixed internal efficiency alone.
Key Figures
| Metric | Value | Sector ⓘ |
|---|---|---|
| Date | Oct 24, 2026 | |
| Context | ||
| Sector | Basic Materials | |
| Industry | Agricultural Inputs | |
| Market Cap ⓘ | $5.68B | |
| Beta ⓘ | 0.92 | |
Value (Cheapness) | ||
| P/E Ratio ⓘ | N/A | 16.92 |
| P/B Ratio ⓘ | 0.50 | 1.66 |
| FCF Yield ⓘ | -16.68% | 5.83% |
| Dividend Yield ⓘ | 4.91% | 2.07% |
| EBIT / EV ⓘ | 6.61% | 6.38% |
| PEG ⓘ | 2.02 | |
Growth (Business expansion) | ||
| Revenue Growth ⓘ | -6.00% | 11.25% |
| RPS Growth (5Y CAGR) ⓘ | 3.94% | 4.49% |
| EPS Growth (5Y CAGR) ⓘ | -66.63% | -15.24% |
| BVPS Growth (5Y CAGR) ⓘ | 7.73% | 5.49% |
| Margin Growth (5Y Trend) ⓘ | -7.69% | -1.54% |
| FCF Growth (5Y CAGR) ⓘ | N/A | 0.37% |
| DPS Growth (5Y CAGR) ⓘ | 34.12% | 5.91% |
Quality (Business durability) | ||
| ROIC (Latest) ⓘ | 3.56% | 9.59% |
| ROA (Latest) ⓘ | 0.18% | 4.92% |
| ROIC (5Y Median) ⓘ | 8.33% | 7.91% |
| ROA (5Y Median) ⓘ | 5.02% | 3.92% |
| Net Debt / EBIT (Latest) ⓘ | 6.40 | 1.36 |
| Net Debt / EBIT (5Y Median) ⓘ | 2.41 | 1.69 |
| Net Debt / EBITDA (Latest) ⓘ | 2.75 | 0.93 |
| Net Debt / Assets ⓘ | 22.57% | 13.69% |
| EBITDA / Interest ⓘ | 8.89 | 12.38 |
| Operating Margin (Latest) ⓘ | 7.31% | 13.24% |
| Operating Margin (5Y Median) ⓘ | 11.89% | 11.82% |
| Debt to Equity (Latest) ⓘ | 51.08% | 40.30% |
| Profit Margin (Latest) ⓘ | -5.21% | 6.38% |
| Free Cash Flow (Latest) ⓘ | -$947.10M | |
Momentum (Price trend) | ||
| 3Y Return ⓘ | -45.19% | +73.47% |
| 12M Return (excl. last month) ⓘ | -26.56% | +27.59% |
| 6M Return ⓘ | -25.57% | -4.02% |
| Price vs. 200-Day MA ⓘ | -25.77% | -0.65% |
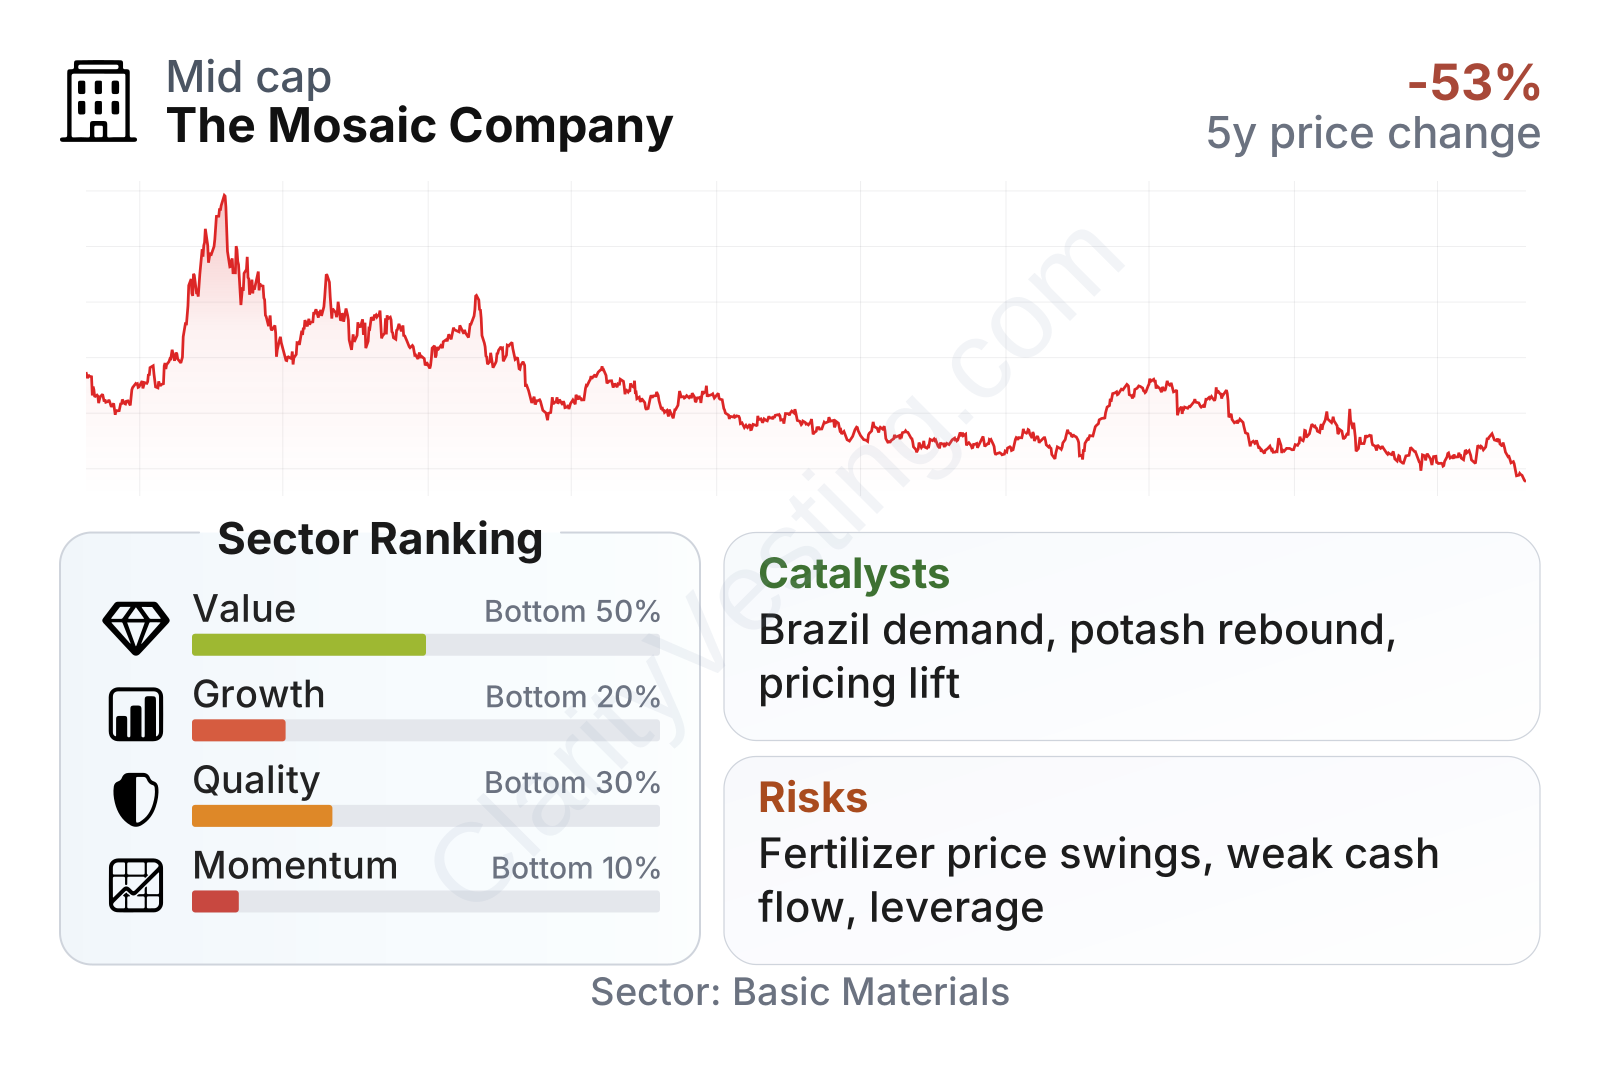
Mosaic is a mid-sized materials company with a stock that has been far more volatile than its current beta alone might suggest, because earnings are tied to commodity conditions. The table points to a mixed profile: valuation ratios based on assets look low, the dividend yield is above the sector median, but growth, profitability, and market momentum are currently weak versus peers. The gap between a low price-to-book ratio and weaker returns on capital suggests the market is discounting the company’s assets because recent earnings power has been under pressure.
The broad picture is that Mosaic looks inexpensive on some balance-sheet-based measures, but less compelling on cash generation and recent operating performance. That combination is common in cyclical businesses near the softer part of the cycle: the market often gives credit for hard assets, but not for earnings until margins visibly improve.
Growth
Agricultural inputs are part of a sector with durable long-term demand. Global food consumption rises over time, arable land per person is limited, and crop yields matter more every year. That supports a long-run need for fertilizer. In that sense, Mosaic operates in an industry with structural relevance. However, this is not a simple high-growth sector. Demand is steady over long periods, but revenue and profit can still be highly cyclical because nutrient prices, farmer purchasing patterns, and global trade flows change quickly.
Mosaic’s strategy for future growth is logical for its industry. The company focuses on low-cost production, operating reliability, and maintaining a broad geographic footprint, especially in North America and Brazil. Brazil is particularly important because it is one of the largest agricultural markets in the world and remains a major fertilizer importer and consumer. That gives Mosaic exposure to a region where crop production has expanded over time and where local distribution scale can matter.
The revenue trend shows how sharp the cycle has been. After the extraordinary surge in 2022, sales declined through much of 2023 and 2024, then showed signs of stabilization and partial rebound before softening again more recently. That does not look like a clean growth trajectory, but it does fit the typical pattern of a fertilizer producer moving through a volatile pricing environment.
Cash generation has also weakened materially from the peak. Mosaic produced very strong free cash flow when fertilizer pricing was favorable, but that tailwind faded and trailing cash flow has turned negative. For long-term analysis, this is important: the company’s upside usually comes when volume, pricing, and operating leverage improve together, but weak free cash flow means the rebound is not yet fully visible in current fundamentals.
The most meaningful catalysts are tied to fertilizer market recovery rather than a single breakthrough product. Stronger crop economics, tighter global nutrient supply, better realized phosphate and potash prices, and improved operating rates could all lift earnings materially. Company actions in recent years to streamline assets and emphasize returns over pure volume also make strategic sense, because scale alone does not protect profitability in down cycles.
Recent company updates have also pointed to continued focus on production efficiency, mine and plant reliability, and capital discipline. For Mosaic, these are significant because even moderate price improvement can have an outsized effect on profit when the cost base is already in place. In other words, the main opportunity is operational leverage to a healthier fertilizer cycle.
Risks
This article is for informational purposes only and does not constitute financial advice. Some content is AI-generated. See Disclaimer


