Stock Analysis · Mach Natural Resources LP (MNR)
Overview
Mach Natural Resources LP is an upstream oil and gas company. In simple terms, it focuses on buying, developing, and operating wells that produce crude oil, natural gas, and natural gas liquids. Its properties are concentrated in the Anadarko Basin region, especially in Oklahoma, Kansas, and the Texas Panhandle. This makes Mach a commodity producer rather than a refiner, pipeline operator, or fuel retailer.
The business model is fairly straightforward: produce hydrocarbons from its acreage, sell them into the market, keep operating costs under control, and use the cash flow for distributions, debt management, and additional acquisitions. For a long-term stock analysis, that means the company’s results depend heavily on production volumes, commodity prices, well performance, and how efficiently it manages acquired assets.
Revenue mainly comes from the sale of produced commodities. Based on the company’s disclosures, the mix can shift with market prices and production volumes, but the ranking is generally led by oil, followed by natural gas, then natural gas liquids.
- Crude oil: approximately 50% to 60% of revenue in recent periods. This is typically the most important contributor because oil prices are usually much higher per unit than gas prices.
- Natural gas: approximately 20% to 30% of revenue. This includes gas sold from the company’s operated wells and is more exposed to weak U.S. gas pricing.
- Natural gas liquids: approximately 15% to 25% of revenue. This category includes products such as propane, butane, and other liquids separated from gas streams.
One notable feature of Mach is that it was built with an acquisition-driven approach. Instead of relying mainly on high-risk exploration, it has emphasized mature producing assets with existing infrastructure and a large inventory of low-risk drilling and optimization opportunities. That tends to make the business easier to understand, but it also ties the company closely to the economics of commodity cycles.
The multi-year income flow shows a business that expanded quickly but with profitability moving around as pricing, costs, and financing changed. Revenue climbed sharply from 2021 through 2025, while operating income and net income were much more uneven. Interest expense also became a much larger drag after the company scaled up, which is important when judging how much of gross profit ultimately reaches unitholders.
Key Figures
| Metric | Value | Sector ⓘ |
|---|---|---|
| Date | Oct 17, 2026 | |
| Context | ||
| Sector | Energy | |
| Industry | Oil & Gas E&P | |
| Market Cap ⓘ | $1.85B | |
| Beta ⓘ | -0.37 | |
Value (Cheapness) | ||
| P/E Ratio ⓘ | 18.43 | 15.44 |
| P/B Ratio ⓘ | 0.99 | 1.73 |
| FCF Yield ⓘ | 8.64% | 8.20% |
| Dividend Yield ⓘ | 16.53% | 3.59% |
| EBIT / EV ⓘ | 4.76% | 7.46% |
| PEG ⓘ | N/A | |
Growth (Business expansion) | ||
| Revenue Growth ⓘ | 63.60% | 26.90% |
| RPS Growth (5Y CAGR) ⓘ | 21.27% | 6.90% |
| EPS Growth (5Y CAGR) ⓘ | -9.28% | -15.73% |
| BVPS Growth (5Y CAGR) ⓘ | 50.68% | 6.07% |
| Margin Growth (5Y Trend) ⓘ | -17.37% | 0.58% |
| FCF Growth (5Y CAGR) ⓘ | 10.70% | 1.86% |
| DPS Growth (5Y CAGR) ⓘ | 24.75% | 16.79% |
Quality (Business durability) | ||
| ROIC (Latest) ⓘ | 3.52% | 11.40% |
| ROA (Latest) ⓘ | 6.54% | 6.06% |
| ROIC (5Y Median) ⓘ | 6.79% | 10.30% |
| ROA (5Y Median) ⓘ | 11.23% | 5.42% |
| Net Debt / EBIT (Latest) ⓘ | 8.33 | 1.64 |
| Net Debt / EBIT (5Y Median) ⓘ | 1.88 | 1.83 |
| Net Debt / EBITDA (Latest) ⓘ | 2.32 | 1.08 |
| Net Debt / Assets ⓘ | 31.30% | 17.29% |
| EBITDA / Interest ⓘ | 5.75 | 9.64 |
| Operating Margin (Latest) ⓘ | 9.53% | 16.27% |
| Operating Margin (5Y Median) ⓘ | 35.68% | 20.39% |
| Debt to Equity (Latest) ⓘ | 64.62% | 54.76% |
| Profit Margin (Latest) ⓘ | 7.75% | 8.82% |
| Free Cash Flow (Latest) ⓘ | $159.58M | |
Momentum (Price trend) | ||
| 3Y Return ⓘ | N/A | +67.38% |
| 12M Return (excl. last month) ⓘ | +5.10% | +49.19% |
| 6M Return ⓘ | -7.53% | +7.07% |
| Price vs. 200-Day MA ⓘ | -9.61% | +9.56% |
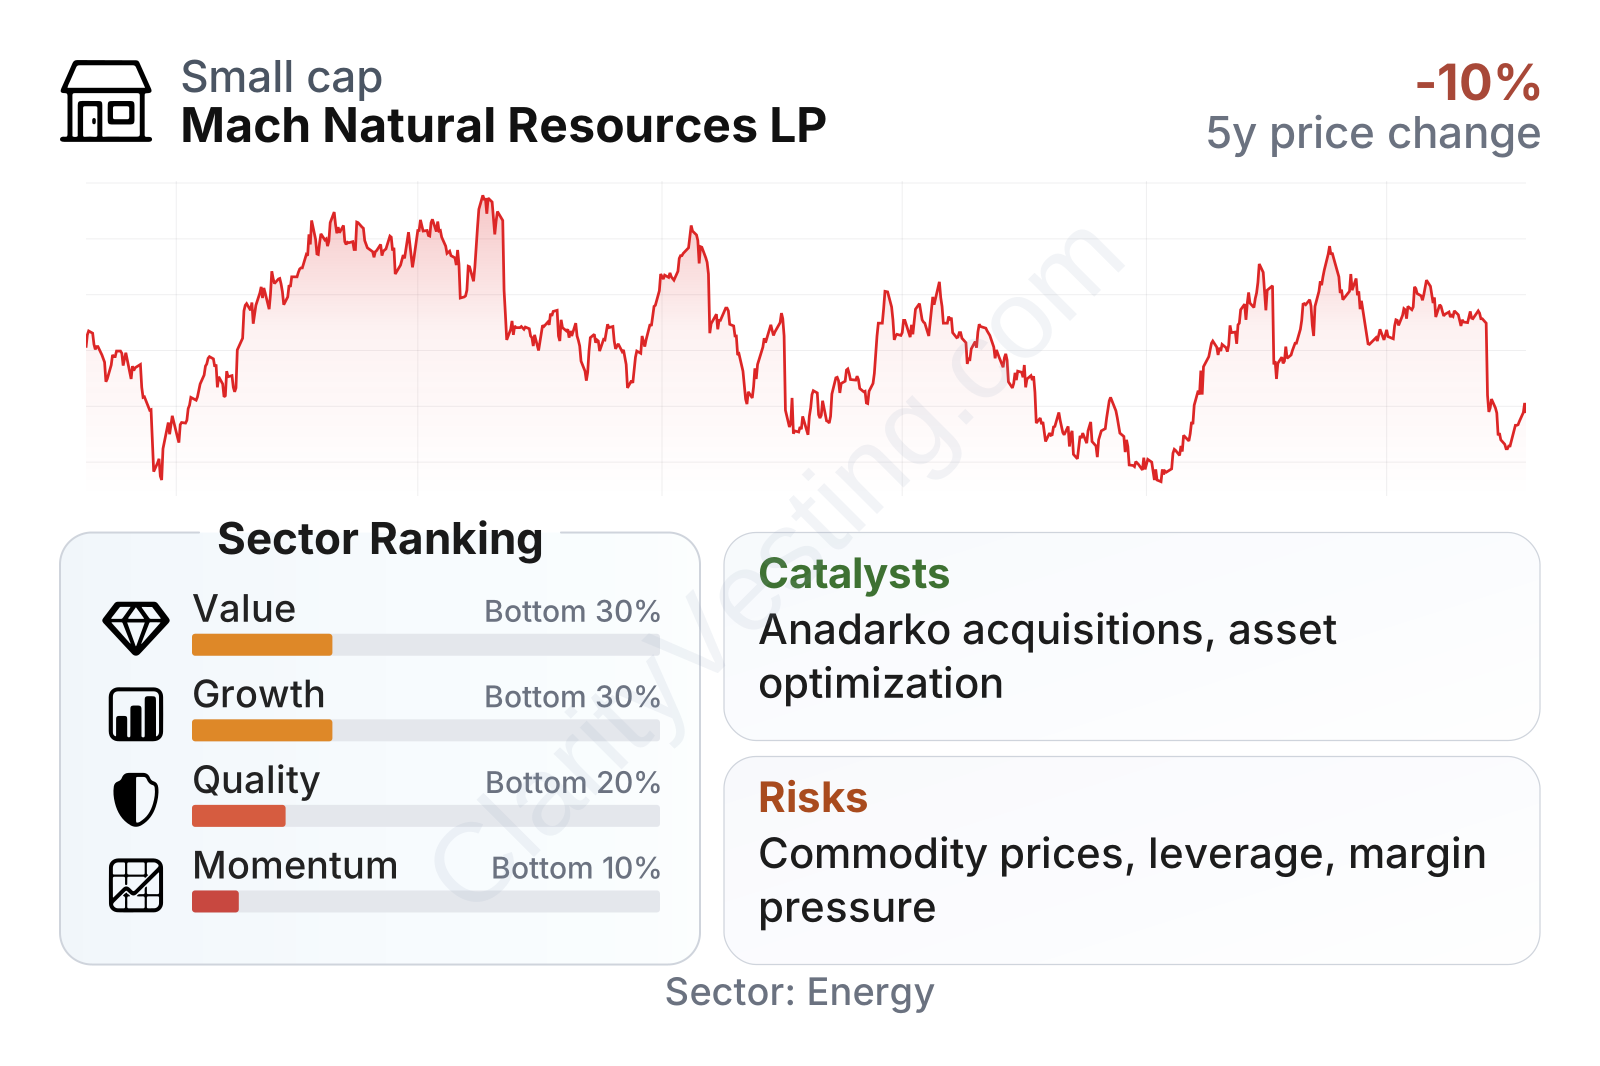
Mach is a small-cap energy producer with a market value around the lower end of the public E&P universe. The overall profile is mixed. On growth, the company has posted very strong top-line expansion versus the sector median, helped by acquisitions and a larger asset base. On quality, however, returns on invested capital are below many peers and leverage metrics are less comfortable than average. The value picture is also not clearly cheap despite the low price-to-book ratio, because earnings multiples and operating-value multiples do not screen especially well relative to the sector. The stock’s recent trading pattern has also lagged most energy names, which signals that the market has been cautious about the current operating outlook.
Growth
Mach operates in a sector that is mature rather than structurally high-growth. Oil and gas demand still matters globally and U.S. production remains strategically important, but long-term growth in this industry usually comes from disciplined acquisitions, efficient development, reserve replacement, and favorable commodity prices rather than from rapid secular expansion. In that setting, Mach’s strategy is logical: buy established assets, improve operations, and generate cash from a large existing production base.
The main reason the company can still grow inside a mature sector is scale. By adding producing properties and then developing lower-risk inventory around them, Mach can lift production and spread fixed costs across a larger base. That appears to be what has happened recently, as revenue growth accelerated well above the industry median. The strongest periods were tied to a much larger operating footprint rather than to a broad industry boom alone.
The recent revenue pattern points to very strong year-over-year expansion, including multiple quarters above 40% and one period near 70%. For a long-term reader, the key nuance is that this is not the same as purely organic growth. In upstream energy, rapid revenue increases often reflect acquisitions and commodity movements as much as drilling success. That can still create value, but it needs to be backed by solid integration and durable free cash flow.
Cash generation has improved materially from the deeply negative level seen earlier in the company’s public history, turning positive and remaining positive more recently. Even so, the trend has not been smooth. The current free cash flow level is positive but lower than its strongest point, which suggests that the company has less room for error if commodity prices soften or capital spending rises.
As for catalysts, the clearest one is Mach’s continued ability to consolidate mature properties in its core region. The Anadarko Basin still offers opportunities to buy assets from larger companies that prefer other basins, and Mach’s operating focus can make these assets more productive under a dedicated owner. A second catalyst is operational optimization: workovers, refracs, infrastructure improvements, and selective drilling can raise output without the risk profile of frontier exploration. A third catalyst is the partnership structure’s high cash distribution model, which can keep market attention on the company as long as operating cash flow remains healthy.
Recent company communications have also highlighted ongoing acquisition activity and portfolio expansion efforts, which reinforce that external growth remains central to the plan. That can be meaningful if new assets are purchased at attractive prices and integrated without stretching the balance sheet.
Risks
This article is for informational purposes only and does not constitute financial advice. Some content is AI-generated. See Disclaimer


