Stock Analysis · Man Group plc (MNGPF)
Overview
Man Group plc is a global asset manager. In simple terms, it manages money on behalf of institutions and wealthy clients, using a mix of investment approaches that include hedge funds, long-only strategies, quantitative investing, discretionary investing, and private markets. The company operates through well-known investment engines such as AHL, GLG, Numeric, and FRM, giving it exposure to both computer-driven and human-led investing.
Its business model is centered on earning fees for managing client assets. That means revenue depends mainly on how much money clients have entrusted to the firm, investment performance, and whether clients are adding or withdrawing capital. As with most listed asset managers, profitability can move up and down with financial markets, investor sentiment, and performance fees.
The main revenue sources are generally structured as follows:
- Management fees: usually the largest source, typically the clear majority of revenue. These recurring fees are charged as a percentage of assets under management and cover strategies across hedge funds, long-only products, multi-manager solutions, and private markets.
- Performance fees: a smaller but more volatile source of revenue, earned when certain funds exceed return targets or high-water marks. This can materially lift profits in strong markets but can fade quickly in weaker periods.
- Other income: a limited contribution that can include interest-related items, balance-sheet income, and smaller ancillary streams.
By investment capability rather than accounting line, Man Group’s economic exposure is tilted toward liquid alternatives and quantitative investing, with additional revenue coming from discretionary strategies, fund-of-funds and solutions, and a growing private markets presence. This mix matters because systematic and alternative strategies are where the firm has built much of its reputation and differentiation.
Recent revenue patterns show a business that can recover strongly when markets and flows cooperate, but reported earnings can still be uneven because fee realization is sensitive to performance. That makes Man Group less predictable than a plain-vanilla index manager, but potentially more differentiated when institutional demand for alternatives is healthy.
The multi-year revenue picture shows why the business needs to be judged over a cycle rather than on one year alone. Revenue rebounded after the 2023 dip and remained above 2021 levels by 2025, but net income was much more volatile, highlighting the sensitivity of margins and incentive fees to market conditions.
Key Figures
| Metric | Value | Sector ⓘ |
|---|---|---|
| Date | Oct 17, 2026 | |
| Context | ||
| Sector | Financial Services | |
| Industry | Asset Management | |
| Market Cap ⓘ | $4.50B | |
| Beta ⓘ | 0.59 | |
Value (Cheapness) | ||
| P/E Ratio ⓘ | 14.50 | 12.26 |
| P/B Ratio ⓘ | 2.91 | 1.23 |
| FCF Yield ⓘ | 14.87% | 10.40% |
| Dividend Yield ⓘ | 4.24% | 3.02% |
| EBIT / EV ⓘ | 13.26% | 8.14% |
| PEG ⓘ | N/A | |
Growth (Business expansion) | ||
| Revenue Growth ⓘ | 47.70% | 9.35% |
| RPS Growth (5Y CAGR) ⓘ | -1.30% | 12.19% |
| EPS Growth (5Y CAGR) ⓘ | -19.06% | -9.53% |
| BVPS Growth (5Y CAGR) ⓘ | -2.63% | 4.99% |
| Margin Growth (5Y Trend) ⓘ | -21.48% | -3.86% |
| FCF Growth (5Y CAGR) ⓘ | -11.93% | 4.81% |
| DPS Growth (5Y CAGR) ⓘ | 3.88% | 8.79% |
Quality (Business durability) | ||
| ROIC (Latest) ⓘ | 30.71% | 9.49% |
| ROE (Latest) ⓘ | 29.20% | 13.90% |
| ROA (Latest) ⓘ | 10.92% | 1.55% |
| ROIC (5Y Median) ⓘ | N/A | 7.86% |
| ROE (5Y Median) ⓘ | 18.13% | 12.17% |
| ROA (5Y Median) ⓘ | 6.66% | 1.30% |
| Net Debt / EBIT (Latest) ⓘ | 0.04 | 0.96 |
| Net Debt / EBIT (5Y Median) ⓘ | 0.05 | 0.73 |
| Net Debt / EBITDA (Latest) ⓘ | 0.03 | 0.92 |
| Operating Margin (Latest) ⓘ | 24.93% | 22.30% |
| Operating Margin (5Y Median) ⓘ | 29.57% | 24.63% |
| Debt to Equity (Latest) ⓘ | 19.06% | 58.56% |
| Profit Margin (Latest) ⓘ | 19.20% | 26.57% |
| Free Cash Flow (Latest) ⓘ | $668.93M | |
Momentum (Price trend) | ||
| 3Y Return ⓘ | +72.42% | +88.33% |
| 12M Return (excl. last month) ⓘ | +98.45% | +19.38% |
| 6M Return ⓘ | +20.20% | +4.75% |
| Price vs. 200-Day MA ⓘ | +37.66% | +3.50% |
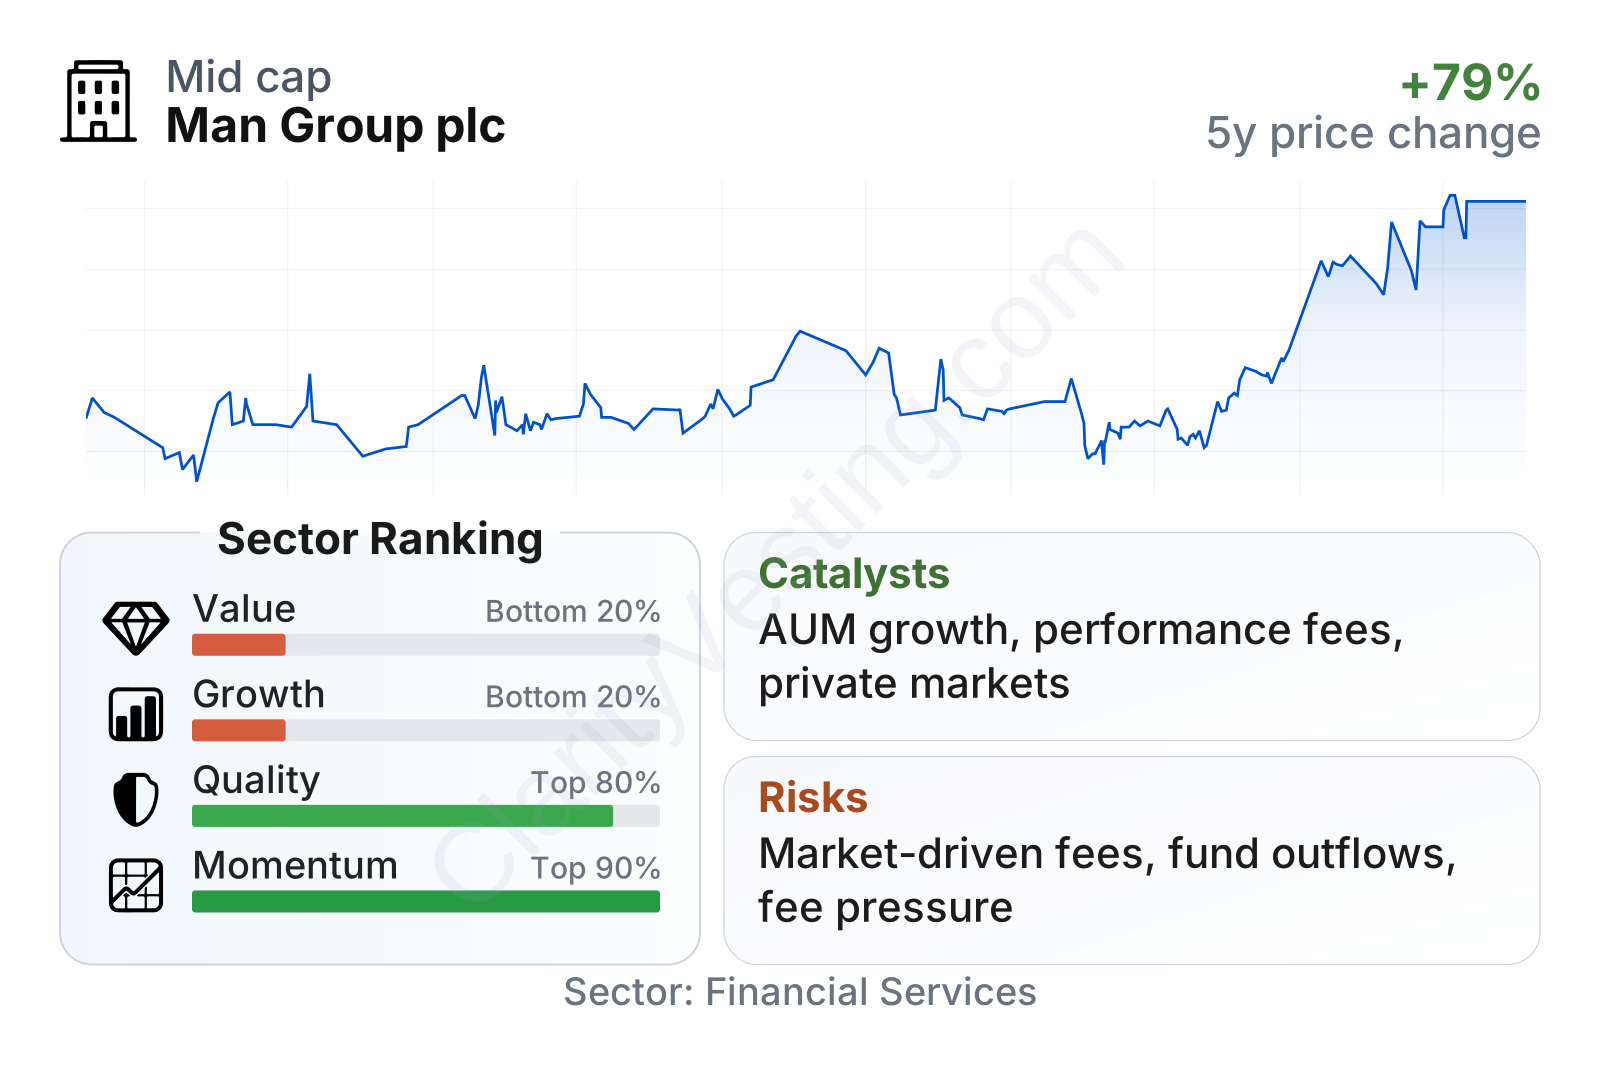
Man Group sits in the mid-sized range within publicly traded financial firms. The latest profile combines strong profitability and balance-sheet discipline with weaker long-term growth trends. Returns on capital, equity, and assets are well above sector medians, while leverage is low, with debt-to-equity around 19% and net debt close to negligible relative to earnings. Free cash flow generation is also substantial, and the dividend yield is above the sector median.
On the other hand, the growth section is less flattering. The most recent year shows a sharp rebound in revenue, but the five-year record for revenue per share, earnings per share, free cash flow, and book value per share is negative. That combination suggests a company that can produce strong cash economics but has had difficulty delivering smooth compounding across a full market cycle.
Share-price momentum has been strong. The stock has risen sharply over the past year and stands well above its long-term moving average, suggesting the market has recently become much more optimistic about the company’s earnings outlook and business quality.
Growth
Man Group operates in a part of asset management that still has structural growth potential. Institutional investors continue to look for diversification beyond traditional stock and bond portfolios, and that supports demand for hedge funds, systematic strategies, credit, and private market capabilities. Quantitative investing also remains relevant as clients seek scalable, data-driven approaches that can be deployed across asset classes and geographies.
Its strategy broadly makes sense for that backdrop. The company has built a multi-engine platform rather than relying on a single investment style. That diversification helps because client demand can rotate between trend-following, long-short equity, discretionary macro, credit, and long-only products. It also gives Man Group cross-selling opportunities with large institutions that prefer to allocate to established global managers.
A notable growth angle is the firm’s combination of alternatives and technology. Man Group has emphasized research, data science, portfolio engineering, and systematic capabilities for years. In an industry where scale, infrastructure, and research spending can create barriers to entry, this can support future product development and institutional credibility.
Another important catalyst is the operating leverage in the business model. When assets under management rise through positive investment performance or client inflows, management fees can scale faster than costs. That means earnings can improve meaningfully in favorable market environments, especially if performance fees also recover.
There is also room for expansion through private markets and solutions-oriented products, where large clients increasingly want customized exposure instead of one-size-fits-all funds. This is not yet the company’s defining segment, but it can help broaden the platform and reduce reliance on more cyclical fee streams.
Book value per share has been uneven rather than steadily rising, which underlines an important point: Man Group’s growth case is more about fee-earning capability, investment performance, and scalable distribution than about a clean, linear increase in balance-sheet value. For asset managers, franchise strength and recurring fee potential often matter more than book value alone, but the inconsistency still shows that compounding has not been smooth.
Recent developments also point to opportunity if market conditions remain supportive. Stronger equity markets, improving appetite for alternatives, and the company’s recent price strength all suggest that the market sees better earnings conditions than it did a few years ago. For a manager with performance-linked revenue, that external backdrop can matter a great deal.
Risks
This article is for informational purposes only and does not constitute financial advice. Some content is AI-generated. See Disclaimer


