Stock Analysis · Marcus & Millichap Inc (MMI)
Overview
Marcus & Millichap is a U.S.-focused commercial real estate brokerage and advisory firm. The company helps property owners, private investors, and institutions buy, sell, finance, and value commercial properties. Its core activity is transaction brokerage, especially in the private-client segment of commercial real estate, where deal sizes are often smaller than those handled by the largest global brokerage houses.
The business is relatively easy to understand: when commercial real estate transactions happen, Marcus & Millichap earns commissions and related fees. That means results are strongly tied to property sales activity, financing conditions, and overall confidence in the real estate market.
Based on company filings, revenue is primarily generated from real estate brokerage commissions, with smaller contributions from financing and other advisory services. The mix can vary by year depending on transaction volume, but the broad structure is as follows:
- Real estate brokerage commissions: approximately 85% to 90% of revenue in recent years. This includes commissions from investment sales across property types such as multifamily, retail, office, industrial, hospitality, and land.
- Financing fees: approximately 8% to 12%. These come from arranging debt and other capital solutions for commercial property transactions.
- Other revenues: approximately 2% to 5%. This includes services such as valuation, research-related activities, and other client support offerings.
One notable feature of the business model is its variable cost structure. A large portion of expenses is tied to commissions paid to brokers, so costs move with revenue to a degree. Even so, the company still carries meaningful fixed overhead in support functions, technology, research, and management, which can pressure profits when transaction activity drops sharply.
The recent financial path shows exactly that pattern: revenue recovered from the 2023 downturn and improved again in 2024 and 2025, but earnings remained much weaker than in the 2021–2022 market environment. Gross profit has held up better than net income, while selling and administrative costs have stayed fairly elevated, limiting margin recovery.
Key Figures
| Metric | Value | Sector ⓘ |
|---|---|---|
| Date | Oct 17, 2026 | |
| Context | ||
| Sector | Real Estate | |
| Industry | Real Estate Services | |
| Market Cap ⓘ | $1.04B | |
| Beta ⓘ | 1.30 | |
Value (Cheapness) | ||
| P/E Ratio ⓘ | 74.00 | 17.38 |
| P/B Ratio ⓘ | 1.86 | 0.85 |
| FCF Yield ⓘ | 9.05% | 7.38% |
| Dividend Yield ⓘ | 1.80% | 4.85% |
| EBIT / EV ⓘ | 2.55% | 3.78% |
| PEG ⓘ | 1.82 | |
Growth (Business expansion) | ||
| Revenue Growth ⓘ | 17.80% | 5.30% |
| RPS Growth (5Y CAGR) ⓘ | -11.95% | 6.02% |
| EPS Growth (5Y CAGR) ⓘ | -72.65% | -11.37% |
| BVPS Growth (5Y CAGR) ⓘ | -2.77% | 0.45% |
| Margin Growth (5Y Trend) ⓘ | -14.45% | -0.22% |
| FCF Growth (5Y CAGR) ⓘ | -30.30% | 5.40% |
| DPS Growth (5Y CAGR) ⓘ | 1.19% | 5.02% |
Quality (Business durability) | ||
| ROIC (Latest) ⓘ | 2.74% | 5.69% |
| ROE (Latest) ⓘ | 2.43% | 7.56% |
| ROA (Latest) ⓘ | 1.82% | 2.85% |
| ROIC (5Y Median) ⓘ | -0.39% | 4.22% |
| ROE (5Y Median) ⓘ | -0.31% | 6.03% |
| ROA (5Y Median) ⓘ | -0.22% | 2.44% |
| Net Debt / EBIT (Latest) ⓘ | -3.12 | 7.59 |
| Net Debt / EBIT (5Y Median) ⓘ | -1.57 | 8.40 |
| Net Debt / EBITDA (Latest) ⓘ | -2.19 | 5.27 |
| Net Debt / Assets ⓘ | -10.36% | 37.76% |
| EBITDA / Interest ⓘ | 53.46 | 4.10 |
| Operating Margin (Latest) ⓘ | 3.14% | 35.29% |
| Operating Margin (5Y Median) ⓘ | 0.50% | 37.31% |
| Debt to Equity (Latest) ⓘ | 12.81% | 88.87% |
| Profit Margin (Latest) ⓘ | 1.77% | 19.61% |
| Free Cash Flow (Latest) ⓘ | $93.83M | |
Momentum (Price trend) | ||
| 3Y Return ⓘ | +2.39% | +30.75% |
| 12M Return (excl. last month) ⓘ | -2.42% | +4.36% |
| 6M Return ⓘ | +5.21% | -2.52% |
| Price vs. 200-Day MA ⓘ | -0.57% | -2.34% |
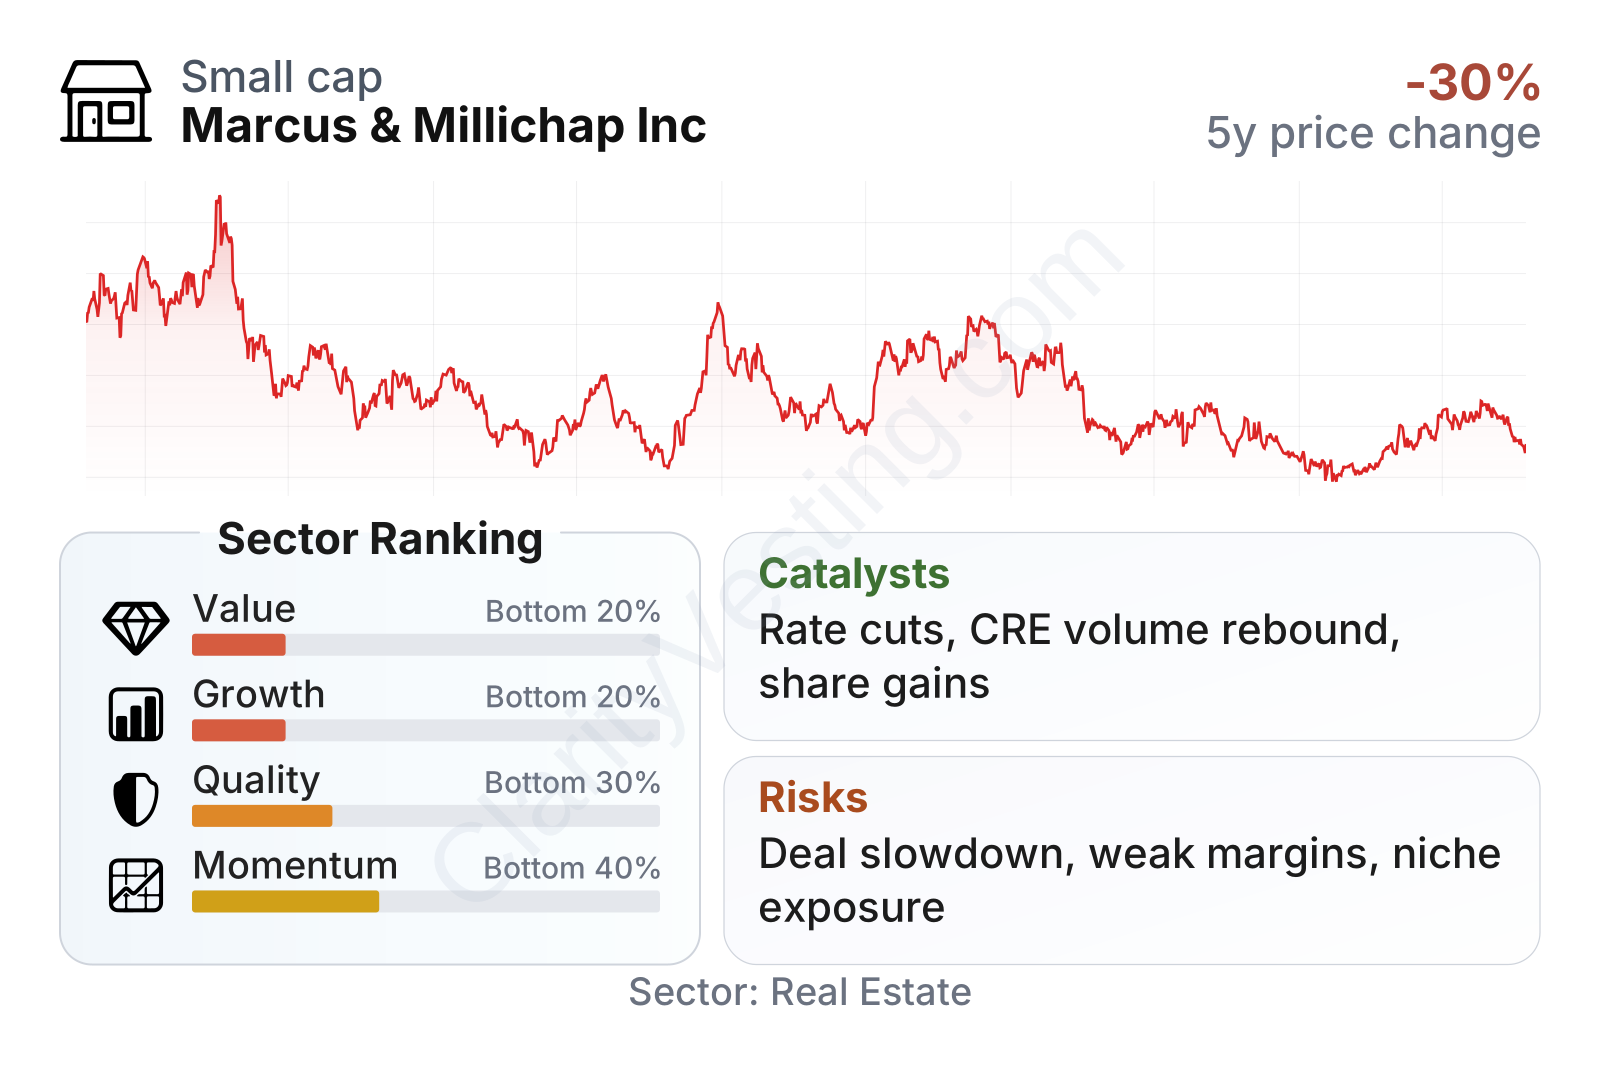
Marcus & Millichap is a small-cap real estate services company with a stock that has been volatile over the past several years. After peaking in 2022, the share price moved lower and then spent much of 2024 through mid-2026 in a recovery range rather than a decisive uptrend.
The metrics table points to a mixed profile. On one hand, the balance sheet looks unusually strong for the sector, with net cash rather than heavy leverage and solid free cash flow generation. On the other hand, profitability, return measures, and multi-year growth rankings sit near the lower end of the real estate peer group. The valuation profile also looks demanding on earnings-based measures, largely because profits remain depressed relative to the company’s more normalized periods.
Growth
Marcus & Millichap operates in commercial real estate services, a sector with long-term relevance but very cyclical short-term demand. Over time, the need to buy, sell, refinance, and reposition income-producing properties does not disappear. However, activity can slow dramatically when interest rates rise, financing becomes harder to secure, or buyers and sellers disagree on asset values. That is the backdrop the company has been dealing with since the post-2022 reset in commercial real estate markets.
The company’s strategy for future growth is logical for its niche. It has built a broad broker network, a recognized brand in private-client commercial investment sales, and a platform that combines brokerage, financing, research, and advisory services. That integrated model can help it capture more revenue per client relationship and maintain relevance even when pure transaction volumes are weak.
Revenue per share fell sharply in 2023 and has only partly recovered since then. The rebound in 2024 and 2025 suggests business conditions improved from the trough, but the company is still well below the unusually strong 2021–2022 period. In other words, growth currently looks more like recovery from a down cycle than a clean long-term expansion trend.
A major catalyst is the direction of interest rates and credit availability. Commercial real estate transaction volumes usually improve when financing becomes more predictable and cap-rate expectations stabilize. If deal flow broadens across property categories, Marcus & Millichap’s commission-heavy model can respond quickly because so much of its revenue depends on completed transactions rather than long-term leases or recurring management fees.
Another potential tailwind is market share. Smaller and mid-sized private investors still represent a very large part of the U.S. commercial property market, and that is where Marcus & Millichap has historically been especially strong. If weaker local brokers struggle in a difficult market, larger specialized platforms can emerge with stronger competitive positions once activity normalizes.
The dividend history also shows a more restrained phase. After an unusually high payout in 2022, the dividend per share has been relatively stable, edging up only modestly since then. That pattern fits a company preserving flexibility while waiting for a fuller earnings recovery rather than signaling aggressive expansion.
Recent company updates have emphasized ongoing hiring, technology investment, and efforts to deepen financing capabilities through Marcus & Millichap Capital Corporation. Those steps are sensible because they reinforce the platform without requiring the balance-sheet risk that property ownership would bring.
Risks
This article is for informational purposes only and does not constitute financial advice. Some content is AI-generated. See Disclaimer


