Stock Analysis · MarketAxess Holdings Inc (MKTX)
Overview
MarketAxess Holdings Inc. operates an electronic trading platform focused mainly on fixed-income markets, especially corporate bonds. In simple terms, it helps large financial institutions such as asset managers, banks, insurance companies, and other professional market participants trade bonds more efficiently through digital networks instead of relying only on traditional voice-based dealing. The company also provides market data, post-trade services, and trading technology used by institutions around the world.
Its business model is largely built on earning fees when clients trade through its platform, along with recurring revenue from subscriptions and technology services. Based on the company’s recent annual reporting structure, the main revenue sources are approximately:
- Commission revenue from trading: about 75% to 80% of total revenue. This includes fees generated from U.S. high-grade bonds, high-yield bonds, emerging markets debt, Eurobonds, municipals, U.S. Treasuries, and other fixed-income products traded electronically.
- Information and post-trade services: about 10% to 15%. This mainly includes data products, pricing information, and services tied to Trax, the company’s post-trade and regulatory reporting operations in Europe.
- Technology and other services: about 10%. This includes connectivity, workflow tools, and software-related services that support institutional trading activity.
What makes MarketAxess distinctive is that it is not a bank taking balance-sheet risk on bonds. It is more of a marketplace and infrastructure provider. That usually makes the business less capital-intensive than many traditional financial firms and can support high margins when trading volumes are healthy.
Over the last several years, revenue has climbed from roughly $700 million to around $850 million, while operating income has stayed strong. Even so, net income did not rise as smoothly, showing that growth has been real but not perfectly steady.
The business mix shows a company that converts a large share of revenue into profit, with gross profit and operating income remaining robust over time. Revenue and gross profit have generally expanded since 2021, while operating expenses have grown more slowly than sales, which supports the economics of the platform model.
Key Figures
| Metric | Value | Sector ⓘ |
|---|---|---|
| Date | Oct 03, 2026 | |
| Context | ||
| Sector | Financial Services | |
| Industry | Capital Markets | |
| Market Cap ⓘ | $5.77B | |
| Beta ⓘ | 0.82 | |
Value (Cheapness) | ||
| P/E Ratio ⓘ | 19.38 | 12.60 |
| P/B Ratio ⓘ | 4.73 | 1.23 |
| FCF Yield ⓘ | 2.77% | 10.16% |
| Dividend Yield ⓘ | 1.88% | 2.96% |
| EBIT / EV ⓘ | 6.47% | 7.77% |
| PEG ⓘ | 1.23 | |
Growth (Business expansion) | ||
| Revenue Growth ⓘ | -0.50% | 9.50% |
| RPS Growth (5Y CAGR) ⓘ | 5.81% | 12.10% |
| EPS Growth (5Y CAGR) ⓘ | -11.54% | -9.45% |
| BVPS Growth (5Y CAGR) ⓘ | 3.01% | 5.01% |
| Margin Growth (5Y Trend) ⓘ | -4.36% | -4.07% |
| FCF Growth (5Y CAGR) ⓘ | 12.74% | 4.96% |
| DPS Growth (5Y CAGR) ⓘ | 4.55% | 8.79% |
Quality (Business durability) | ||
| ROIC (Latest) ⓘ | 22.35% | 9.60% |
| ROE (Latest) ⓘ | 23.65% | 13.84% |
| ROA (Latest) ⓘ | 13.81% | 1.53% |
| ROIC (5Y Median) ⓘ | 21.87% | 7.86% |
| ROE (5Y Median) ⓘ | 21.74% | 12.20% |
| ROA (5Y Median) ⓘ | 14.41% | 1.29% |
| Net Debt / EBIT (Latest) ⓘ | -0.18 | 0.91 |
| Net Debt / EBIT (5Y Median) ⓘ | -1.11 | 0.74 |
| Net Debt / EBITDA (Latest) ⓘ | -0.15 | 0.97 |
| Operating Margin (Latest) ⓘ | 42.34% | 22.12% |
| Operating Margin (5Y Median) ⓘ | 44.57% | 24.39% |
| Debt to Equity (Latest) ⓘ | 14.44% | 60.37% |
| Profit Margin (Latest) ⓘ | 35.22% | 26.62% |
| Free Cash Flow (Latest) ⓘ | $159.94M | |
Momentum (Price trend) | ||
| 3Y Return ⓘ | -18.06% | +89.23% |
| 12M Return (excl. last month) ⓘ | -9.82% | +17.35% |
| 6M Return ⓘ | +0.18% | +10.00% |
| Price vs. 200-Day MA ⓘ | +5.62% | +3.73% |
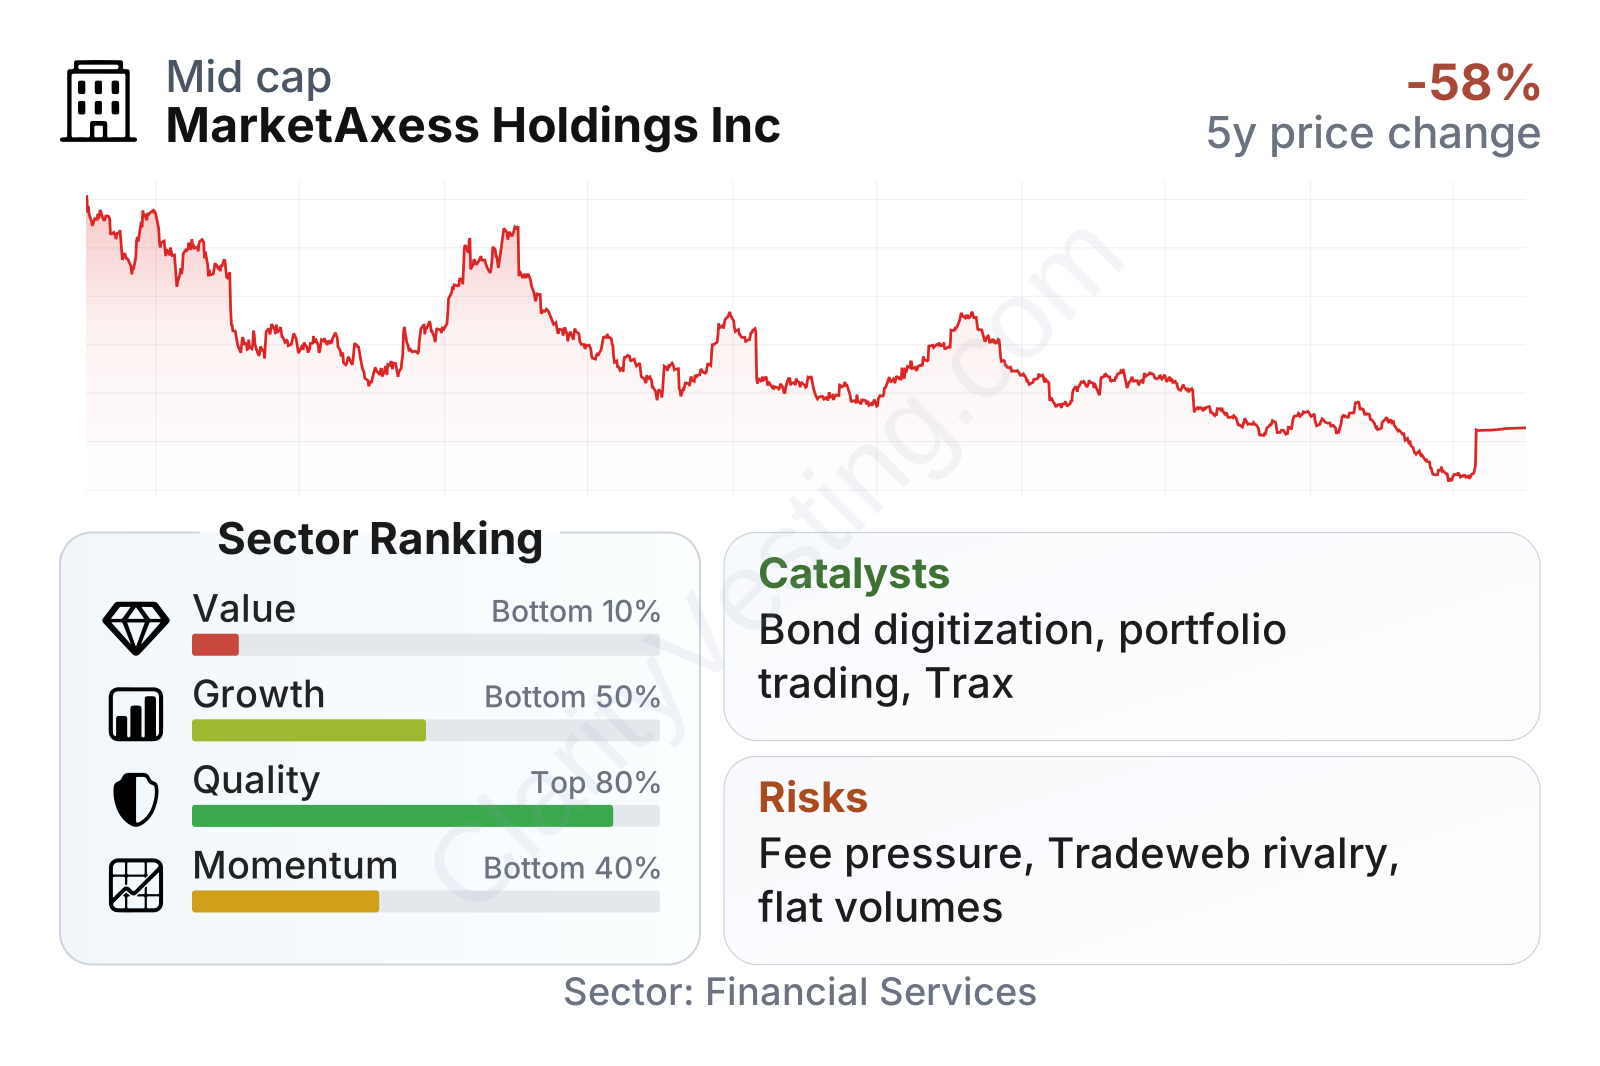
MarketAxess sits in an unusual position: business quality is clearly strong, but valuation and growth rankings are weaker than much of the financial sector. Profitability metrics are well above sector medians, balance-sheet risk is very low, and margins remain high. At the same time, revenue growth has recently been soft, earnings growth over five years has been underwhelming, and the stock’s market performance has lagged for an extended period. This combination often points to a company that is fundamentally solid but still trying to regain a stronger growth profile.
The share price history also reflects that tension. After trading near much higher levels in 2021, the stock has moved through several sharp resets and remains far below prior peaks. That usually suggests the market has lowered expectations around growth, competitive pressure, or both.
Growth
MarketAxess operates in a part of financial services that still has room for long-term digital adoption. Bond trading has historically been less electronic than stock trading, especially in credit markets. That creates a durable industry tailwind: over time, more trading activity can migrate to electronic venues, automated execution, data-driven workflows, and all-to-all liquidity networks. If that shift continues, platforms with established client relationships and proven trading technology should remain relevant.
The company’s strategy is built around exactly that trend. It has expanded beyond U.S. corporate bonds into international credit, emerging markets debt, municipals, Treasuries, portfolio trading, and post-trade services. This matters because it reduces reliance on any one product line and gives clients more reasons to stay within the platform. It also strengthens network effects: the more participants and workflows connected to the system, the more useful the platform becomes.
There are also practical catalysts inside the model. Portfolio trading in fixed income has been growing across the industry, and MarketAxess has been investing to capture more of that activity. The company has also continued developing automated and algorithm-assisted trading tools, which can improve execution and deepen client engagement. In addition, regulatory and operational complexity in Europe supports the value of post-trade and reporting services such as Trax.
Earnings per share have shown gradual recovery from the 2022 dip, moving higher through 2024 and 2025 rather than collapsing. That is encouraging because it suggests the underlying franchise still has pricing power and operating discipline, even if growth has not been spectacular.
Book value per share rose steadily for several years before dropping in 2025, so the longer-term capital base has expanded but not in a perfectly straight line. For a platform business like this, book value is less important than trading activity, margins, and cash generation, yet the broader trend still points to a company that has historically added economic value over time.
Recent corporate developments also point to continued expansion efforts rather than retrenchment. The company has kept investing in trading protocols, institutional workflow tools, and international reach. For long-term analysis, the important question is not whether one quarter is strong or weak, but whether MarketAxess can capture a bigger share of a market that is still becoming more electronic. That opportunity remains intact.
Risks
This article is for informational purposes only and does not constitute financial advice. Some content is AI-generated. See Disclaimer


