Stock Analysis · Mirum Pharmaceuticals Inc (MIRM)
Overview
Mirum Pharmaceuticals is a biotechnology company focused on rare liver diseases and related disorders. Its business centers on developing and commercializing medicines for patients with serious conditions that often have limited treatment options. This is a specialized part of healthcare: patient populations are small, but therapies can command high prices if they address unmet medical needs and show clear clinical benefit.
The company’s revenue is mainly generated from product sales. Based on recent company reporting, the largest source is LIVMARLI (maralixibat), a treatment used in rare cholestatic liver diseases. A second, much smaller source is CHOLBAM and related bile acid products acquired through Mirum’s purchase of Travere Therapeutics’ bile acid portfolio. There can also be small amounts from collaboration or other revenue, but product sales dominate the business.
- LIVMARLI: approximately 80% to 90% of revenue. This is the company’s core growth engine and includes sales across approved rare liver disease indications and geographies.
- CHOLBAM and other bile acid products: approximately 10% to 20% of revenue. These products treat rare bile acid synthesis disorders and add a second commercial base.
- Other revenue: typically a small residual amount when present, such as collaboration-related items or non-recurring revenue.
What stands out is the speed of Mirum’s commercial build-out. Revenue has climbed from a very small base a few years ago to more than $500 million in 2025, showing that the company is no longer just a research platform; it now has a meaningful rare-disease commercial franchise. At the same time, spending on research and commercialization remains high, which explains why accounting profits are still under pressure even as sales expand.
The long-term trend is encouraging: revenue has grown sharply, gross profit has expanded with it, and losses narrowed materially by 2025. The main tension is that operating expenses, especially selling and administrative costs and research spending, have also risen as Mirum invests in launches, new indications, and pipeline programs.
Key Figures
| Metric | Value | Sector ⓘ |
|---|---|---|
| Date | Oct 24, 2026 | |
| Context | ||
| Sector | Healthcare | |
| Industry | Biotechnology | |
| Market Cap ⓘ | $5.42B | |
| Beta ⓘ | 0.61 | |
Value (Cheapness) | ||
| P/E Ratio ⓘ | N/A | 25.42 |
| P/B Ratio ⓘ | N/A | 3.08 |
| FCF Yield ⓘ | -8.46% | 3.12% |
| Dividend Yield ⓘ | N/A | 1.85% |
| EBIT / EV ⓘ | -13.10% | 0.56% |
| PEG ⓘ | N/A | |
Growth (Business expansion) | ||
| Revenue Growth ⓘ | 37.90% | 7.50% |
| RPS Growth (5Y CAGR) ⓘ | 101.40% | 8.60% |
| EPS Growth (5Y CAGR) ⓘ | -18.35% | -17.73% |
| BVPS Growth (5Y CAGR) ⓘ | 12.14% | 3.72% |
| Margin Growth (5Y Trend) ⓘ | N/A | -0.57% |
| FCF Growth (5Y CAGR) ⓘ | N/A | 0.96% |
| DPS Growth (5Y CAGR) ⓘ | N/A | 6.69% |
Quality (Business durability) | ||
| ROIC (Latest) ⓘ | -99.30% | 3.17% |
| ROA (Latest) ⓘ | -94.01% | 2.98% |
| ROIC (5Y Median) ⓘ | -32.97% | 4.56% |
| ROA (5Y Median) ⓘ | -31.37% | 1.87% |
| Net Debt / EBIT (Latest) ⓘ | N/A | 1.34 |
| Net Debt / EBIT (5Y Median) ⓘ | N/A | 1.86 |
| Net Debt / EBITDA (Latest) ⓘ | N/A | 1.00 |
| Net Debt / Assets ⓘ | 41.13% | 5.06% |
| EBITDA / Interest ⓘ | N/A | 9.55 |
| Operating Margin (Latest) ⓘ | -129.88% | 9.25% |
| Operating Margin (5Y Median) ⓘ | -79.04% | 7.33% |
| Debt to Equity (Latest) ⓘ | -7297.49% | 26.68% |
| Profit Margin (Latest) ⓘ | -139.18% | 3.34% |
| Free Cash Flow (Latest) ⓘ | -$458.17M | |
Momentum (Price trend) | ||
| 3Y Return ⓘ | +197.96% | +51.61% |
| 12M Return (excl. last month) ⓘ | +23.62% | +19.90% |
| 6M Return ⓘ | -11.89% | +10.10% |
| Price vs. 200-Day MA ⓘ | -15.75% | +6.44% |
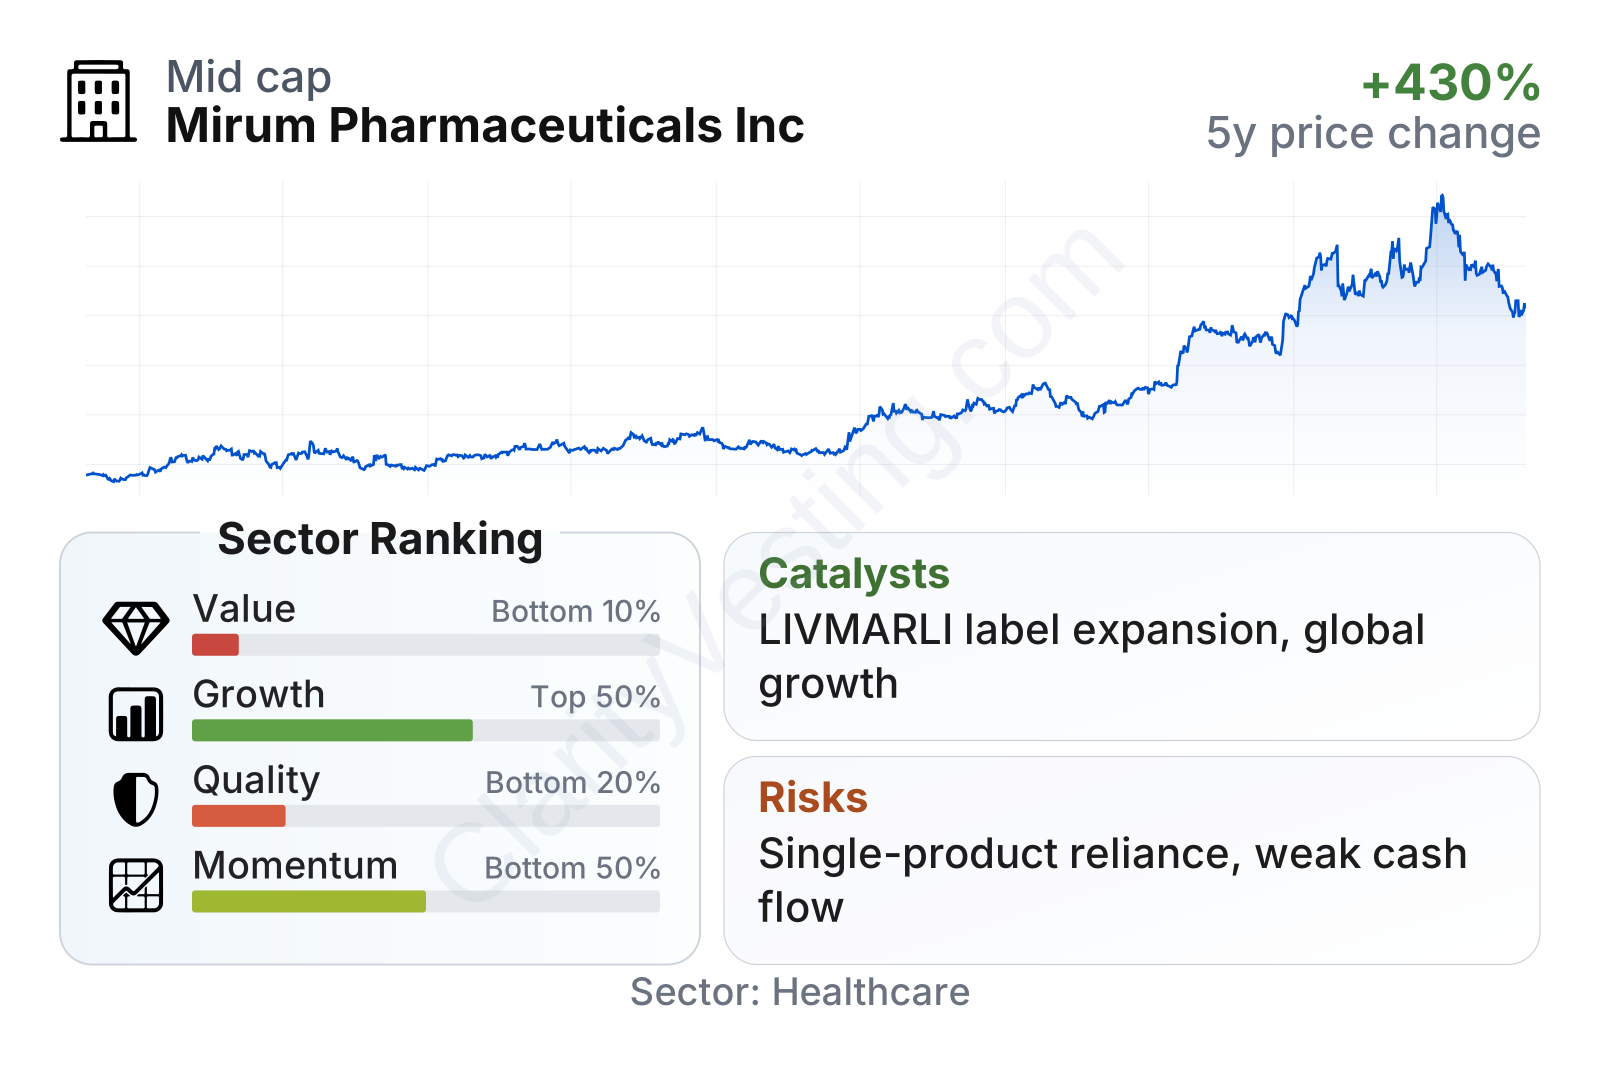
Mirum is now a mid-sized biotechnology company by market value, and its share price has risen strongly over the last three years. The stock’s beta is relatively low, which suggests lower sensitivity to broad market swings than many biotech names, although company-specific clinical and regulatory events can still create sharp moves.
The factor profile is mixed. Growth is clearly the strongest area, with revenue expansion far above the healthcare sector median. Momentum has also been favorable over a multi-year period, reflecting improving business scale and investor confidence. By contrast, value metrics screen poorly because the company is still loss-making and free cash flow remains negative. Quality metrics also rank weakly, mainly due to negative returns on capital, weak margins, and a balance sheet that now looks more stretched than earlier in the company’s commercial phase.
Growth
Mirum operates in an attractive niche of healthcare. Rare diseases are often a favorable market structure because competition can be limited, physicians tend to concentrate in specialist centers, and approved drugs can remain important for many years if they become part of standard care. In liver diseases with severe itching, bile flow disorders, and pediatric rare conditions, there is still substantial unmet need, which supports further adoption when a therapy works well in practice.
The company’s strategy is straightforward and makes sense for long-term expansion: build around approved rare-disease products, add new labeled indications for the lead franchise, extend internationally, and use the commercial infrastructure to support additional launches. That is generally a more durable strategy than depending on a single late-stage binary trial.
Revenue growth remains strong even after the earliest launch surge. Year-over-year growth has moderated from triple-digit rates seen during the initial ramp, but recent growth is still around the high-30% range, which remains far above typical sector growth. That slowdown is not necessarily a negative sign by itself; it is normal once a business becomes larger. The key question is whether Mirum can keep adding patients, countries, and indications fast enough to maintain above-average expansion.
Cash generation is the weaker part of the growth profile. Free cash flow improved significantly through 2024 and early 2025, but the trailing twelve-month figure moved sharply lower again in 2026. That likely reflects the cost of scaling the commercial platform, pipeline spending, working capital swings, or transaction-related effects rather than a collapse in demand. Even so, it matters because long-term value creation becomes much clearer once a rare-disease company can consistently turn revenue growth into cash generation.
A major catalyst is continued expansion of LIVMARLI. Mirum has been pursuing broader use of the drug across rare cholestatic diseases, and each added indication can deepen the product’s reach without requiring the company to build an entirely new sales model. The bile acid portfolio also gives Mirum another commercial asset base that can support cross-selling in highly specialized physician networks.
Recent company updates have also pointed to pipeline and regulatory progress across both commercial and development programs. For a company like Mirum, meaningful opportunities usually come from three places at once: more approved uses for existing drugs, new geographic launches, and clinical data that increase confidence in follow-on products. That combination is more powerful than relying on only one event.
Risks
This article is for informational purposes only and does not constitute financial advice. Some content is AI-generated. See Disclaimer


