Stock Analysis · Mirion Technologies Inc (MIR)
Overview
Mirion Technologies is a specialized industrial company focused on radiation detection, measurement, analysis, and monitoring. Its products are used where radiation must be measured accurately and safely, including nuclear power plants, medical imaging and cancer treatment facilities, laboratories, defense programs, and industrial environments. In simple terms, Mirion sells the instruments, systems, software, and related services that help customers work with radiation safely, comply with regulations, and keep critical operations running.
The company reports two main business segments. Based on its recent annual reporting, revenue is split approximately as follows:
- Nuclear & Safety: about 58% to 62% of revenue. This segment includes radiation monitoring systems for nuclear power plants, dosimetry and safety products, defense-related applications, reactor measurement tools, and service work tied to installed systems.
- Medical: about 38% to 42% of revenue. This business serves radiation therapy, nuclear medicine, diagnostic imaging, and medical quality assurance, including detectors, imaging components, and related software and services.
That mix matters because it gives Mirion exposure to two durable end markets: nuclear safety, where reliability and regulation are central, and healthcare, where radiation-based diagnosis and treatment remain essential.
Over the last several years, the business has expanded revenue steadily, from a little above $600 million in 2021 to more than $900 million in 2025. At the same time, gross profit has improved, suggesting the company is scaling better than it did just after becoming public. Profitability at the bottom line has lagged because interest expense and operating costs remained heavy, but the overall revenue base is clearly larger than it was a few years ago.
The broad pattern is encouraging: sales and gross profit have risen consistently, operating income turned positive again by 2024 and improved further in 2025, and interest expense eased from earlier peaks. The key remaining challenge is converting that progress into stronger net margins and returns on capital.
Key Figures
| Metric | Value | Sector ⓘ |
|---|---|---|
| Date | Oct 24, 2026 | |
| Context | ||
| Sector | Industrials | |
| Industry | Specialty Industrial Machinery | |
| Market Cap ⓘ | $3.80B | |
| Beta ⓘ | 1.10 | |
Value (Cheapness) | ||
| P/E Ratio ⓘ | 169.33 | 22.29 |
| P/B Ratio ⓘ | 2.38 | 1.98 |
| FCF Yield ⓘ | 3.60% | 6.26% |
| Dividend Yield ⓘ | N/A | 1.92% |
| EBIT / EV ⓘ | 1.33% | 4.83% |
| PEG ⓘ | N/A | |
Growth (Business expansion) | ||
| Revenue Growth ⓘ | 19.70% | 9.30% |
| RPS Growth (5Y CAGR) ⓘ | 4.79% | 7.76% |
| EPS Growth (5Y CAGR) ⓘ | -12.95% | -13.17% |
| BVPS Growth (5Y CAGR) ⓘ | -3.85% | 6.13% |
| Margin Growth (5Y Trend) ⓘ | 6.26% | 0.74% |
| FCF Growth (5Y CAGR) ⓘ | N/A | 10.79% |
| DPS Growth (5Y CAGR) ⓘ | N/A | 9.41% |
Quality (Business durability) | ||
| ROIC (Latest) ⓘ | 2.22% | 10.75% |
| ROA (Latest) ⓘ | 0.70% | 5.41% |
| ROIC (5Y Median) ⓘ | 0.54% | 9.37% |
| ROA (5Y Median) ⓘ | -3.55% | 4.95% |
| Net Debt / EBIT (Latest) ⓘ | 12.51 | 2.04 |
| Net Debt / EBIT (5Y Median) ⓘ | 19.05 | 2.27 |
| Net Debt / EBITDA (Latest) ⓘ | 3.78 | 1.39 |
| Net Debt / Assets ⓘ | 23.13% | 19.27% |
| EBITDA / Interest ⓘ | 6.20 | 9.58 |
| Operating Margin (Latest) ⓘ | 6.35% | 10.49% |
| Operating Margin (5Y Median) ⓘ | 1.83% | 10.30% |
| Debt to Equity (Latest) ⓘ | 67.54% | 64.82% |
| Profit Margin (Latest) ⓘ | 2.39% | 6.67% |
| Free Cash Flow (Latest) ⓘ | $136.80M | |
Momentum (Price trend) | ||
| 3Y Return ⓘ | +119.26% | +67.77% |
| 12M Return (excl. last month) ⓘ | -33.67% | +12.05% |
| 6M Return ⓘ | -21.82% | 0.00% |
| Price vs. 200-Day MA ⓘ | -17.44% | +0.67% |
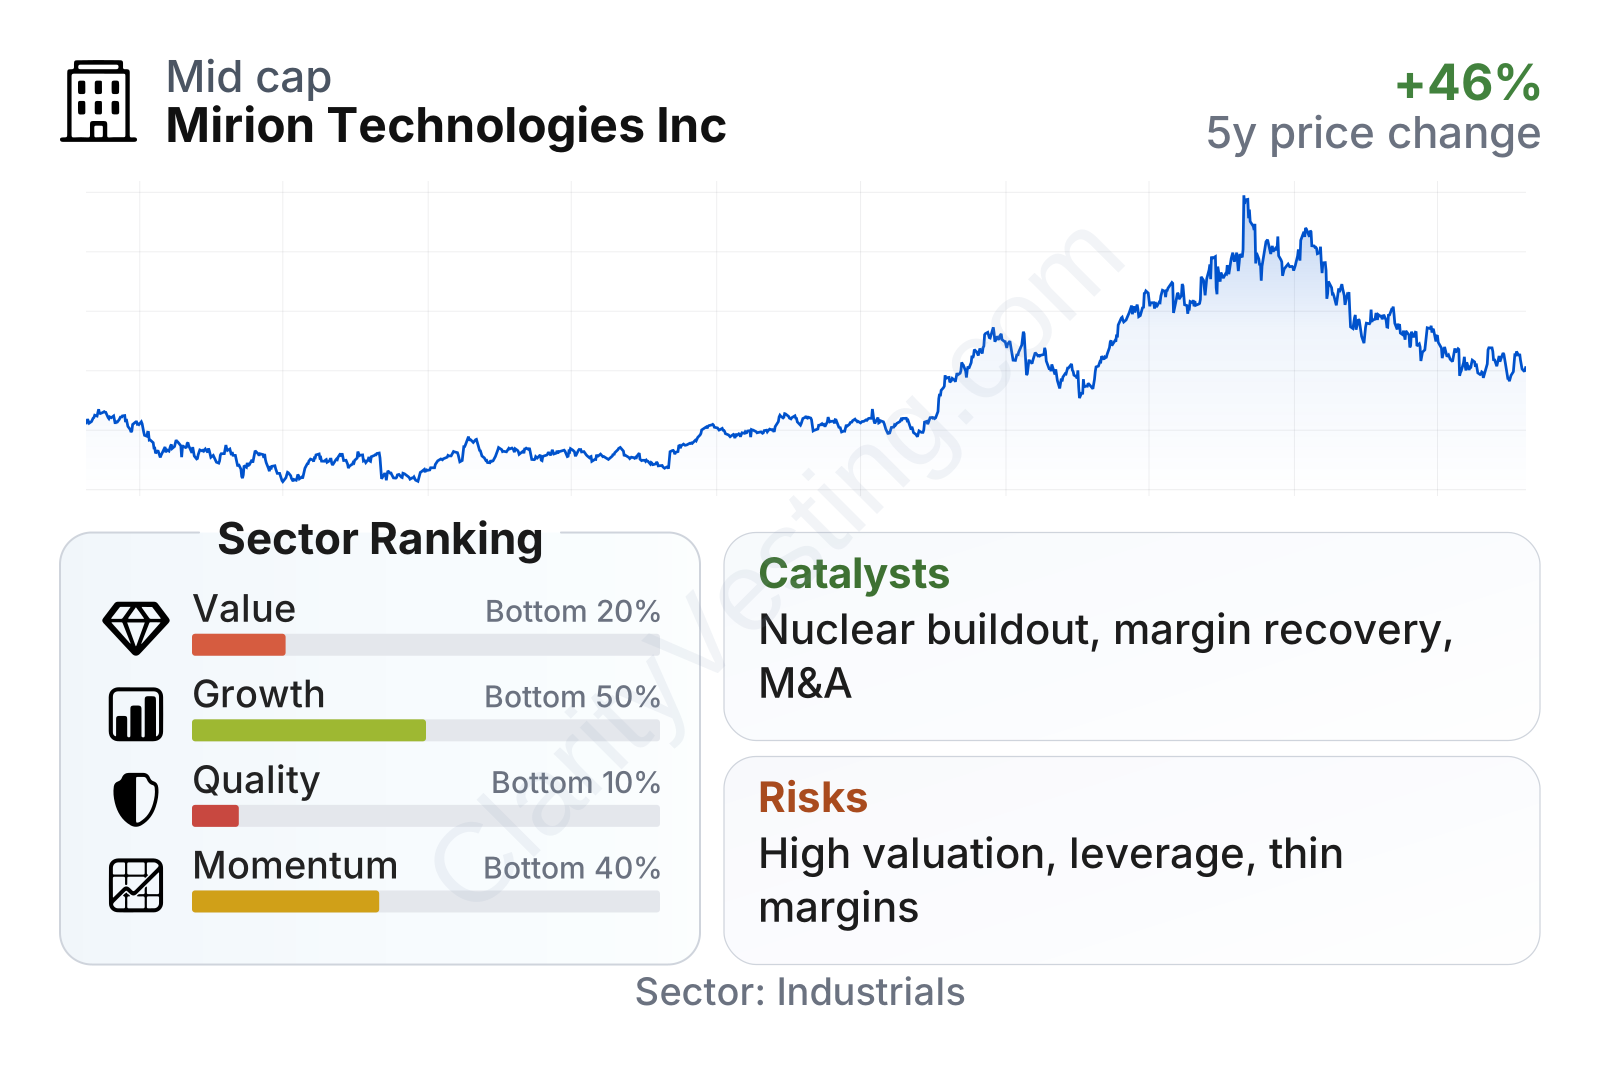
Mirion sits in the mid-cap range and its share price has been volatile. The stock rose strongly over the last three years, but more recent performance has been weaker, with the shares well below their earlier 2026 level and trading under the long-term trend line. On fundamentals, the company currently ranks poorly on value and quality versus much of the industrial sector, while growth is mixed: recent revenue expansion is strong, but long-term per-share growth and profitability measures still look modest.
The table also highlights an important contrast. Mirion is now producing positive free cash flow and has shown improving operating trends, yet its earnings-based valuation remains far above the sector median. That usually means the market is pricing in continued margin improvement rather than current profitability.
Growth
Mirion operates in sectors with long-duration demand. Nuclear power requires strict radiation monitoring and periodic equipment upgrades, and that need does not disappear when electricity prices change. In healthcare, radiation remains essential in cancer treatment and imaging, supporting demand for measurement and quality assurance products. Those are attractive end markets because they are tied to safety, regulation, installed equipment, and mission-critical workflows rather than discretionary spending alone.
The company’s strategy also has a logical long-term shape. It combines hardware, recurring services, software, and a large installed base in regulated environments. Once equipment is qualified and in use at a nuclear facility or medical site, replacement cycles, service contracts, and compliance requirements can create repeat business. That does not make revenue immune to cycles, but it can make it more resilient than ordinary industrial equipment sales.
Recent growth has clearly accelerated. Revenue growth was mostly in the mid-single-digit to low-double-digit range through much of 2024 and 2025, then stepped up materially in early 2026, with year-over-year growth moving close to 20% and above in the latest quarters shown. That is notably faster than the broader sector median and suggests either stronger end-market demand, acquisition help, or both.
Cash generation has improved as well. Free cash flow moved from near break-even or negative levels a few years ago to a clearly positive level, reaching roughly $90 million on a trailing basis by early 2026 in the chart and about $137 million on the latest trailing twelve-month measure in the key metrics. For a company still rebuilding profitability, that matters because cash can support debt reduction, investment, and acquisition capacity.
A major catalyst for Mirion is the ongoing global focus on nuclear energy and nuclear modernization. New reactor projects, life extensions for existing plants, fuel cycle investments, defense-related nuclear programs, and heightened safety requirements all support demand for radiation detection and monitoring. In healthcare, cancer treatment volumes and the need for precision quality assurance remain structural supports.
Recent company communications have also pointed to portfolio expansion through acquisitions and product launches. Mirion has been active in adding capabilities that deepen its presence in dosimetry, nuclear instrumentation, and medical applications. For a company of this size, successful integration and cross-selling can create meaningful growth opportunities if execution remains disciplined.
Risks
This article is for informational purposes only and does not constitute financial advice. Some content is AI-generated. See Disclaimer


