Stock Analysis · Miami International Holdings Inc (MIAX)
Overview
Miami International Holdings Inc. operates U.S. securities exchanges and related market infrastructure. Its best-known assets are the MIAX options exchanges, but the group has expanded into equities, futures, U.S. Treasuries trading technology, and market data. In simple terms, it runs marketplaces where financial products are traded and earns money from the activity that happens on those venues, as well as from the technology and data tied to them.
The business has become broader over time. The company started in options, where it operates multiple exchanges, and later added the Minneapolis Grain Exchange futures business, The Bermuda Stock Exchange, and a U.S. Treasury trading and workflow platform through the acquisition of Dorman Trading and, more recently, LedgerX and the acquisition of GFA Group's technology assets for U.S. rates trading infrastructure. That makes MIAX more diversified than a pure options-exchange operator, although listed options still appear to be the core engine.
Based on company disclosures, the main revenue streams are built around transaction fees and exchange services. Public filings do not always break every line into a clean percentage mix for all businesses, but the company’s revenue profile can be summarized approximately as follows:
- Transaction and clearing-related fees: roughly 70% to 80% — fees tied to options, futures, and other trading activity executed on MIAX-operated venues.
- Access, membership, connectivity, and market data: roughly 15% to 25% — recurring fees paid by trading firms and other users for exchange access, ports, connectivity, proprietary data, and related services.
- Technology and other services: roughly 5% to 10% — software, trading infrastructure, and other exchange-related or post-trade services, including newer treasury-market technology activities.
The broad pattern is clear even if exact percentages move year to year: MIAX is primarily a trading-volume business, with an added layer of recurring infrastructure and data revenue that can improve resilience.
The company’s recent financial path shows fast top-line growth, but earnings have been uneven. Revenue climbed from about $752 million in 2021 to about $1.36 billion in 2025, while net income moved from losses to profit and back again depending on integration costs, operating expenses, and business mix. That combination matters for long-term analysis: MIAX is no longer a niche exchange operator, but it is still proving that its larger platform can produce steadier profitability.
The financial flow over the last several years shows a business that has expanded meaningfully in scale, but with expenses rising quickly alongside revenue. Gross profit improved strongly through 2025, yet swings in operating income and net income suggest MIAX is still in a transition phase as it invests in growth and absorbs newer businesses.
Key Figures
| Metric | Value | Sector ⓘ |
|---|---|---|
| Date | Oct 24, 2026 | |
| Context | ||
| Sector | Financial Services | |
| Industry | Capital Markets | |
| Market Cap ⓘ | $3.33B | |
| Beta ⓘ | N/A | |
Value (Cheapness) | ||
| P/E Ratio ⓘ | 33.58 | 12.46 |
| P/B Ratio ⓘ | 3.37 | 1.25 |
| FCF Yield ⓘ | 7.46% | 9.82% |
| Dividend Yield ⓘ | N/A | 2.94% |
| EBIT / EV ⓘ | 2.08% | 8.11% |
| PEG ⓘ | N/A | |
Growth (Business expansion) | ||
| Revenue Growth ⓘ | 18.30% | 9.10% |
| RPS Growth (5Y CAGR) ⓘ | 19.87% | 12.31% |
| EPS Growth (5Y CAGR) ⓘ | N/A | -6.97% |
| BVPS Growth (5Y CAGR) ⓘ | N/A | 5.02% |
| Margin Growth (5Y Trend) ⓘ | N/A | -4.00% |
| FCF Growth (5Y CAGR) ⓘ | 120.18% | 4.71% |
| DPS Growth (5Y CAGR) ⓘ | N/A | 8.92% |
Quality (Business durability) | ||
| ROIC (Latest) ⓘ | 16.96% | 9.18% |
| ROE (Latest) ⓘ | 14.36% | 13.93% |
| ROA (Latest) ⓘ | 10.07% | 1.57% |
| ROIC (5Y Median) ⓘ | N/A | 7.80% |
| ROE (5Y Median) ⓘ | -11.22% | 12.15% |
| ROA (5Y Median) ⓘ | -2.83% | 1.28% |
| Net Debt / EBIT (Latest) ⓘ | -10.90 | 1.02 |
| Net Debt / EBIT (5Y Median) ⓘ | N/A | 0.72 |
| Net Debt / EBITDA (Latest) ⓘ | -7.04 | 0.88 |
| Operating Margin (Latest) ⓘ | 4.12% | 22.30% |
| Operating Margin (5Y Median) ⓘ | -0.31% | 24.50% |
| Debt to Equity (Latest) ⓘ | 0.13% | 59.34% |
| Profit Margin (Latest) ⓘ | 9.70% | 26.42% |
| Free Cash Flow (Latest) ⓘ | $248.70M | |
Momentum (Price trend) | ||
| 3Y Return ⓘ | N/A | +95.73% |
| 12M Return (excl. last month) ⓘ | -6.98% | +17.30% |
| 6M Return ⓘ | -22.69% | +6.07% |
| Price vs. 200-Day MA ⓘ | -16.03% | +5.36% |
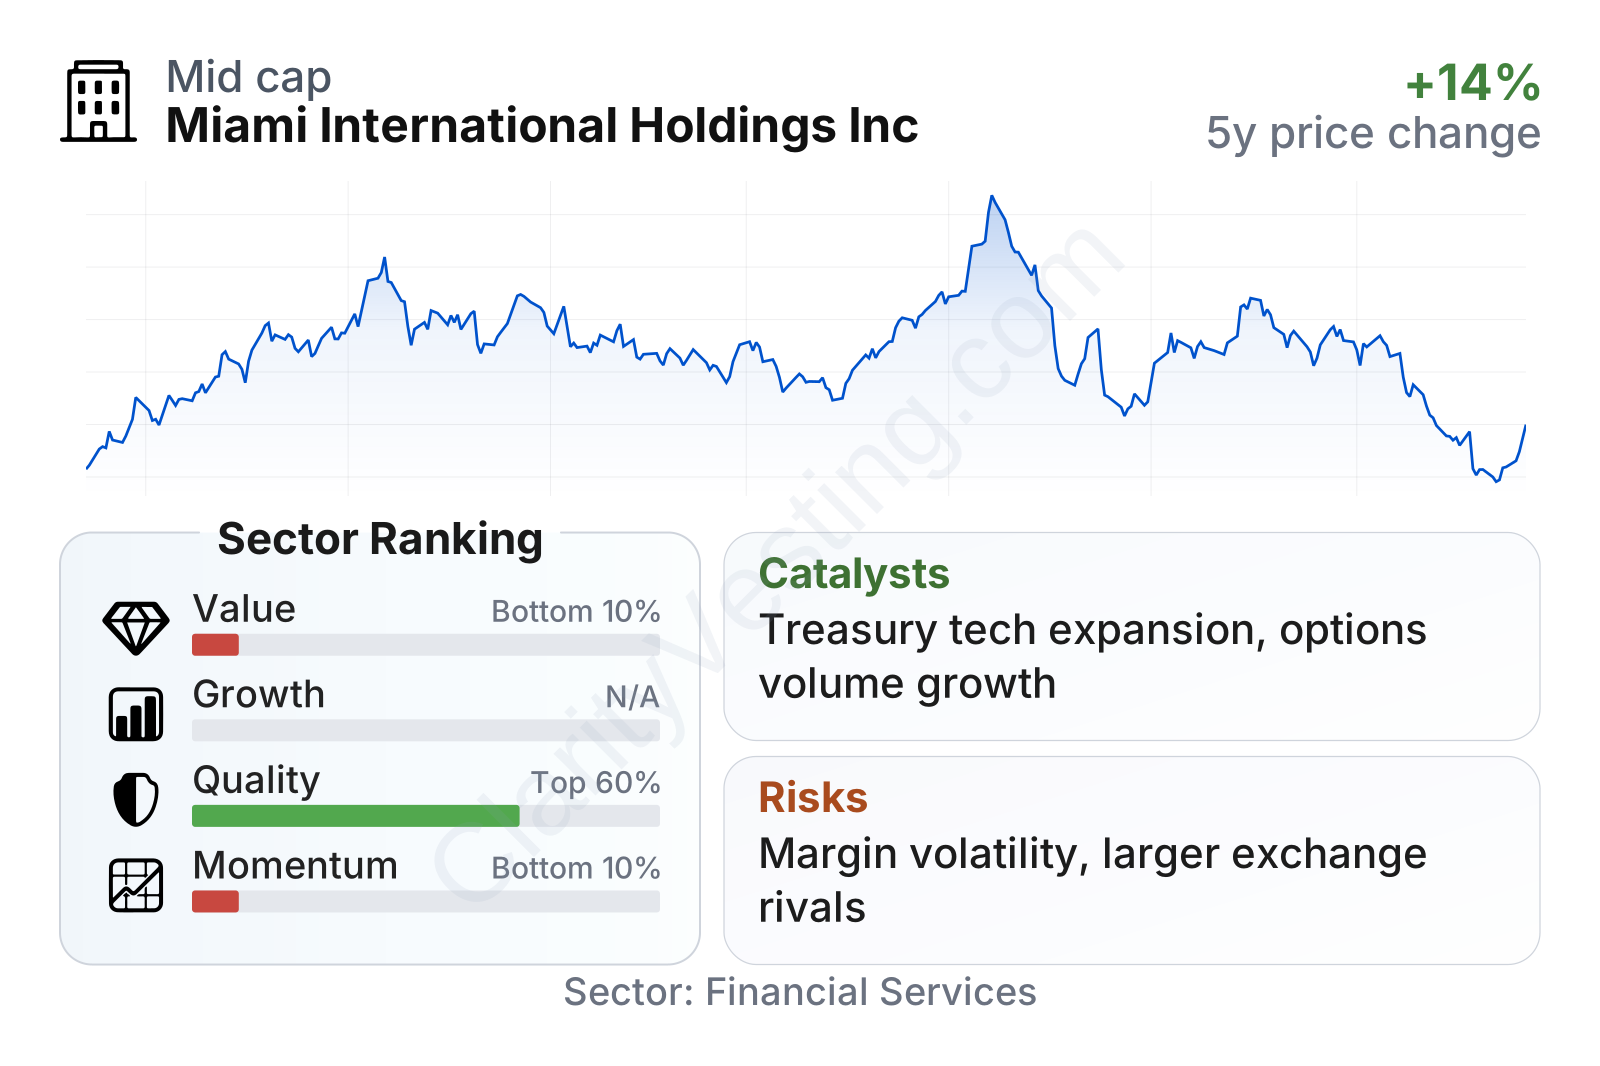
MIAX sits in the mid-cap range, large enough to matter in its niche but still much smaller than the biggest exchange groups. The latest profile shows a mixed setup: growth has been stronger than the sector median, quality is modestly above average, but value metrics look expensive relative to other financial-services companies and recent share-price momentum has been weak. Free cash flow remains solid, leverage is very low, and returns on capital are respectable, but operating and profit margins remain below typical sector levels.
Growth
MIAX operates in a sector with durable long-term tailwinds. Electronic trading, the continued shift toward automated execution, demand for market data, and the need for specialized trading infrastructure all support the exchange and market-technology industry. Options trading in particular has grown structurally in the U.S. over the past decade, supported by higher retail participation, institutional hedging needs, and more product innovation. That backdrop gives MIAX exposure to a market that has expanded faster than many traditional financial subsegments.
The company’s strategy also has a clear industrial logic. Rather than depending on a single exchange, MIAX has been building a broader network of trading venues and technology assets. In theory, that can create cross-selling opportunities, deeper customer relationships, and more ways to monetize order flow, data, and connectivity. It also gives the company a path to diversify beyond listed options, especially through futures and Treasury-market infrastructure. For a long-term assessment, that is one of the most important points: management appears to be trying to turn MIAX from a specialized exchange operator into a wider market-structure platform.
Recent growth metrics support that expansion narrative. Revenue growth over the last year has outpaced the sector median, and five-year revenue-per-share growth has also been stronger than many peers. Free cash flow growth over five years is especially notable, even if that measure can be volatile. The challenge is that revenue growth has not yet translated into consistently strong margins.
The recent earnings-per-share trend looks stable rather than sharply accelerating. That suggests the company has reached a more profitable base than in earlier years, but it has not yet demonstrated the kind of steady earnings compounding that typically defines more mature exchange operators.
Book value per share has improved dramatically in recent years, moving from negative territory to a much stronger positive base. That is an important sign that the balance sheet and retained economics of the business have improved materially, even if the market is already assigning a premium to that progress.
A meaningful catalyst is MIAX’s continuing push into fixed-income and futures infrastructure. Public company updates in 2026 highlighted efforts around U.S. Treasury workflow and trading technology as well as broader exchange and clearing capabilities. If the company can scale these activities, it could tap a much larger addressable market than options alone. Another catalyst is simple volume growth: when trading activity is healthy, exchange businesses often benefit quickly because the infrastructure is already in place.
Risks
This article is for informational purposes only and does not constitute financial advice. Some content is AI-generated. See Disclaimer


