Stock Analysis · McGraw Hill Inc (MH)
Overview
McGraw Hill is an education company that develops learning content, digital courseware, assessment tools, and teaching platforms for schools, colleges, and professional learners. Its best-known products include K-12 instructional materials, higher education textbooks and digital learning systems, and tools that help teachers assign, track, and personalize learning. The business is tied to long educational cycles, which can create recurring demand from schools and institutions once products are adopted.
The company’s revenue base is spread across the main parts of the education market. Based on company reporting and business descriptions, the largest sources of revenue are broadly the following:
- Higher Education: approximately 40% to 50% of revenue. This includes college textbooks, e-books, homework and course platforms, and inclusive access digital products used by universities and students.
- K-12: approximately 35% to 45% of revenue. This covers core curriculum, supplemental learning materials, and digital solutions sold to school districts and state education systems.
- Professional and international or other learning solutions: approximately 10% to 20% of revenue. This includes career learning, workforce-related content, and selected international education activities.
What stands out in the financial profile is the combination of high gross profit and improving operating income. Over the last several fiscal years, revenue has climbed from roughly $1.8 billion to just above $2.1 billion, while operating income has improved much faster. Interest expense has remained a major drag, but the business recently moved back to positive net income, which is an important shift for a company with meaningful debt.
The business mix suggests a content-and-platform model rather than a low-margin distribution model. Cost of revenue has stayed relatively contained while gross profit remained strong, indicating that digital delivery and established intellectual property continue to support profitability.
Key Figures
| Metric | Value | Sector ⓘ |
|---|---|---|
| Date | Oct 17, 2026 | |
| Context | ||
| Sector | Consumer Defensive | |
| Industry | Education & Training Services | |
| Market Cap ⓘ | $2.60B | |
| Beta ⓘ | N/A | |
Value (Cheapness) | ||
| P/E Ratio ⓘ | 28.89 | 17.88 |
| P/B Ratio ⓘ | 3.26 | 1.29 |
| FCF Yield ⓘ | 13.81% | 12.39% |
| Dividend Yield ⓘ | N/A | 2.85% |
| EBIT / EV ⓘ | 6.50% | 6.43% |
| PEG ⓘ | N/A | |
Growth (Business expansion) | ||
| Revenue Growth ⓘ | 2.60% | 4.10% |
| RPS Growth (5Y CAGR) ⓘ | 5.13% | 6.18% |
| EPS Growth (5Y CAGR) ⓘ | N/A | -13.59% |
| BVPS Growth (5Y CAGR) ⓘ | -5.55% | 3.20% |
| Margin Growth (5Y Trend) ⓘ | 11.90% | -0.15% |
| FCF Growth (5Y CAGR) ⓘ | 8.92% | 4.10% |
| DPS Growth (5Y CAGR) ⓘ | N/A | 6.79% |
Quality (Business durability) | ||
| ROIC (Latest) ⓘ | 9.50% | 12.34% |
| ROA (Latest) ⓘ | 1.62% | 6.30% |
| ROIC (5Y Median) ⓘ | N/A | 10.49% |
| ROA (5Y Median) ⓘ | -3.25% | 5.44% |
| Net Debt / EBIT (Latest) ⓘ | 7.64 | 1.96 |
| Net Debt / EBIT (5Y Median) ⓘ | 16.24 | 2.35 |
| Net Debt / EBITDA (Latest) ⓘ | 3.70 | 1.38 |
| Net Debt / Assets ⓘ | 45.74% | 21.51% |
| EBITDA / Interest ⓘ | 3.43 | 9.46 |
| Operating Margin (Latest) ⓘ | 15.21% | 8.87% |
| Operating Margin (5Y Median) ⓘ | 10.45% | 9.53% |
| Debt to Equity (Latest) ⓘ | 336.61% | 72.35% |
| Profit Margin (Latest) ⓘ | 4.38% | 5.40% |
| Free Cash Flow (Latest) ⓘ | $358.71M | |
Momentum (Price trend) | ||
| 3Y Return ⓘ | N/A | +20.92% |
| 12M Return (excl. last month) ⓘ | -16.93% | +2.13% |
| 6M Return ⓘ | -0.07% | +1.26% |
| Price vs. 200-Day MA ⓘ | +5.30% | +1.39% |
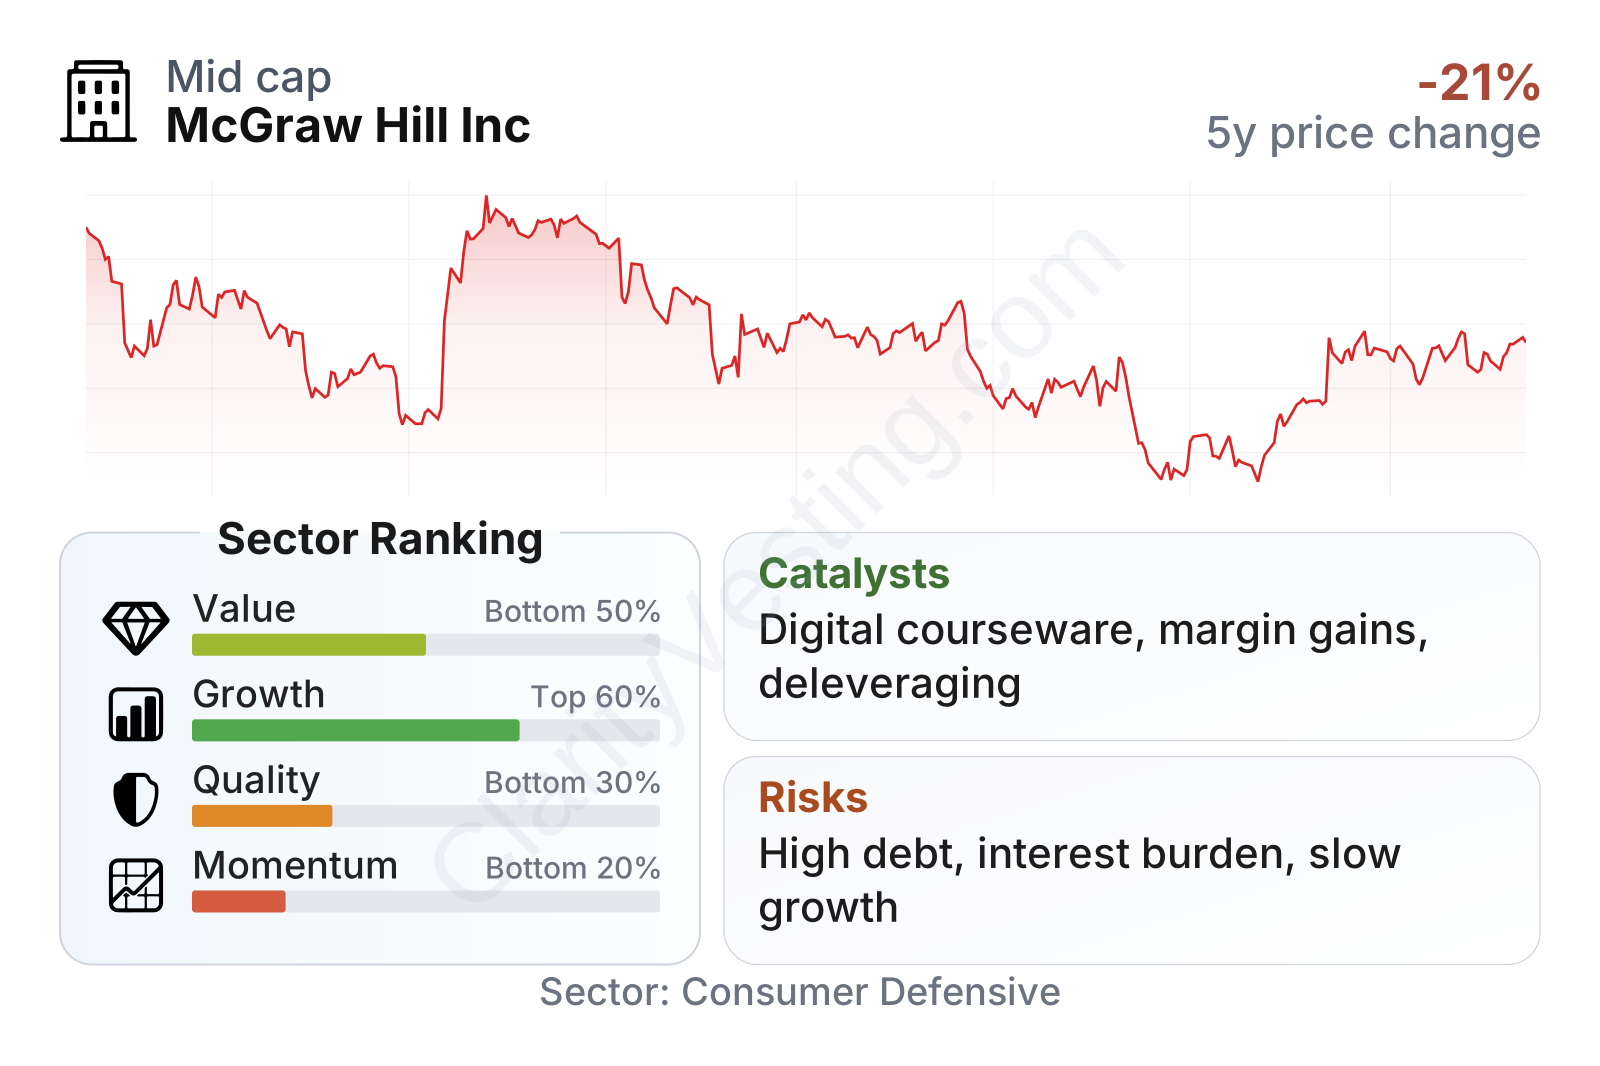
McGraw Hill sits in the mid-cap range and shows a mixed profile. Growth and cash generation look better than some peers, especially in free cash flow over a multi-year period and in improving operating margins. At the same time, quality indicators are held back by heavy leverage and weaker returns on assets than the sector median. Valuation metrics also look uneven: cash-flow-based measures are not stretched, but earnings and book-value multiples are above typical sector levels.
The recent share-price trend has been weak. The stock has moved down materially over the last year, and momentum indicators place it below many sector peers. That drop may reflect caution around leverage, profitability consistency, or the company’s slower near-term revenue expansion versus some other consumer defensive names.
Growth
McGraw Hill operates in a sector that is growing, but not usually at a fast pace. Education publishing and digital learning benefit from long-term demand for curriculum updates, student affordability tools, online learning, and data-driven instruction. The strongest structural trend is the shift from one-time print sales toward digital platforms, subscriptions, and integrated learning ecosystems. That direction fits McGraw Hill’s strategy well.
The company’s strategy appears sensible for future growth because it leans on content it already owns while increasing digital distribution and workflow integration. In practice, that means more courseware, adaptive learning, assignment platforms, analytics, and institution-wide access models. These offerings can deepen customer relationships and make switching less convenient once a school or college has embedded them in teaching processes.
Near-term growth looks modest rather than explosive. Recent year-over-year revenue growth has been in the low-single-digit range, and on a five-year basis revenue per share growth has been positive but not exceptional versus the sector median. The more encouraging signal is margin expansion: operating profitability has improved significantly over five years, which suggests the company has been getting more efficient even without rapid top-line acceleration.
Free cash flow remains one of the more attractive parts of the picture. Although trailing cash generation has softened from late 2025 to early 2026, the broader trend over several years has been favorable, and the current free-cash-flow yield is above the sector median. For a business in education, this matters because cash generation supports debt reduction, product investment, and resilience during uneven school purchasing cycles.
A meaningful catalyst is the continued expansion of digital-first learning models in higher education, especially inclusive access and courseware tied directly to student usage. Another positive factor is the return to positive net income in the latest fiscal year, combined with lower interest expense than the year before. That does not remove balance-sheet pressure, but it improves the company’s flexibility if operating gains continue.
Risks
This article is for informational purposes only and does not constitute financial advice. Some content is AI-generated. See Disclaimer


