Stock Analysis · M&G Plc (MGPUF)
Overview
M&G Plc is a U.K.-based savings and investment group active in asset management, retirement products, and life insurance. The company serves individual savers, financial advisers, pension schemes, and institutional clients. Its business model combines fee-based activities, such as managing client assets, with capital-intensive activities, such as annuities and life insurance. That mix makes M&G different from a pure asset manager: part of its earnings depends on market levels and net client flows, while another part depends on insurance spreads, capital management, and long-duration liabilities.
The group reports revenue through operating segments rather than the simple product labels most people know. Based on recent annual reporting, the business is mainly organized around asset management and retail savings, with a meaningful contribution from its insurance and annuity operations, while smaller activities include corporate functions and other legacy items. Because accounting for insurers and investment groups can swing sharply with market moves, exact percentages can vary a lot from one year to the next. At a high level, M&G’s economic revenue sources can be described as follows:
- Asset management fees: approximately 35% to 45% of underlying operating earnings. This includes managing money for institutions, wholesale clients, and retail distribution channels across fixed income, equities, multi-asset, and private markets.
- Retail and adviser-linked savings platforms: approximately 20% to 30%. This includes investment wrappers, savings products, and adviser-served customer assets, where revenue is tied to account balances and administration fees.
- Life insurance and annuities: approximately 25% to 35%. This includes mature savings books, annuities, and spread-based insurance activities where profitability depends on investment returns, claims experience, and capital efficiency.
- Other and corporate items: usually less than 10%. This includes central costs, treasury-related items, and legacy runoff activities.
M&G also has a large in-force customer base and a sizeable asset pool, which matters because scale is central in this industry: larger firms can spread technology, compliance, and distribution costs over more assets. The tradeoff is that reported earnings can look volatile, especially when markets move sharply or when valuation changes hit insurance-related accounts.
The longer-term revenue path has not been smooth. Recent years show big swings between revenue, operating profit, and net income, which is common for financial groups exposed to both capital markets and insurance accounting. Even so, cash generation has remained more resilient than headline earnings in some periods, which is an important distinction for a company like M&G.
The overall pattern shows a business with uneven reported revenue but still capable of producing meaningful operating income and cash flow. The gap between accounting profit and cash generation is worth watching closely because it shapes how the market interprets dividend capacity and balance-sheet strength.
Key Figures
| Metric | Value | Sector ⓘ |
|---|---|---|
| Date | Oct 17, 2026 | |
| Context | ||
| Sector | Financial Services | |
| Industry | Asset Management | |
| Market Cap ⓘ | $9.97B | |
| Beta ⓘ | 0.97 | |
Value (Cheapness) | ||
| P/E Ratio ⓘ | N/A | 12.26 |
| P/B Ratio ⓘ | 5.21 | 1.23 |
| FCF Yield ⓘ | 17.52% | 10.40% |
| Dividend Yield ⓘ | 4.92% | 3.02% |
| EBIT / EV ⓘ | N/A | 8.14% |
| PEG ⓘ | N/A | |
Growth (Business expansion) | ||
| Revenue Growth ⓘ | -6.60% | 9.35% |
| RPS Growth (5Y CAGR) ⓘ | -35.83% | 12.19% |
| EPS Growth (5Y CAGR) ⓘ | -10.02% | -9.53% |
| BVPS Growth (5Y CAGR) ⓘ | -17.99% | 4.99% |
| Margin Growth (5Y Trend) ⓘ | 42.21% | -3.86% |
| FCF Growth (5Y CAGR) ⓘ | 3.27% | 4.81% |
| DPS Growth (5Y CAGR) ⓘ | -5.32% | 8.79% |
Quality (Business durability) | ||
| ROIC (Latest) ⓘ | N/A | 9.49% |
| ROE (Latest) ⓘ | -5.76% | 13.90% |
| ROA (Latest) ⓘ | -0.09% | 1.55% |
| ROIC (5Y Median) ⓘ | 0.92% | 7.86% |
| ROE (5Y Median) ⓘ | 1.53% | 12.17% |
| ROA (5Y Median) ⓘ | 0.04% | 1.30% |
| Net Debt / EBIT (Latest) ⓘ | N/A | 0.96 |
| Net Debt / EBIT (5Y Median) ⓘ | 2.39 | 0.73 |
| Net Debt / EBITDA (Latest) ⓘ | 0.41 | 0.92 |
| Operating Margin (Latest) ⓘ | N/A | 22.30% |
| Operating Margin (5Y Median) ⓘ | 10.33% | 24.63% |
| Debt to Equity (Latest) ⓘ | 246.60% | 58.56% |
| Profit Margin (Latest) ⓘ | -1.56% | 26.57% |
| Free Cash Flow (Latest) ⓘ | $1.75B | |
Momentum (Price trend) | ||
| 3Y Return ⓘ | +135.01% | +88.33% |
| 12M Return (excl. last month) ⓘ | +52.20% | +19.38% |
| 6M Return ⓘ | -1.30% | +4.75% |
| Price vs. 200-Day MA ⓘ | +22.01% | +3.50% |
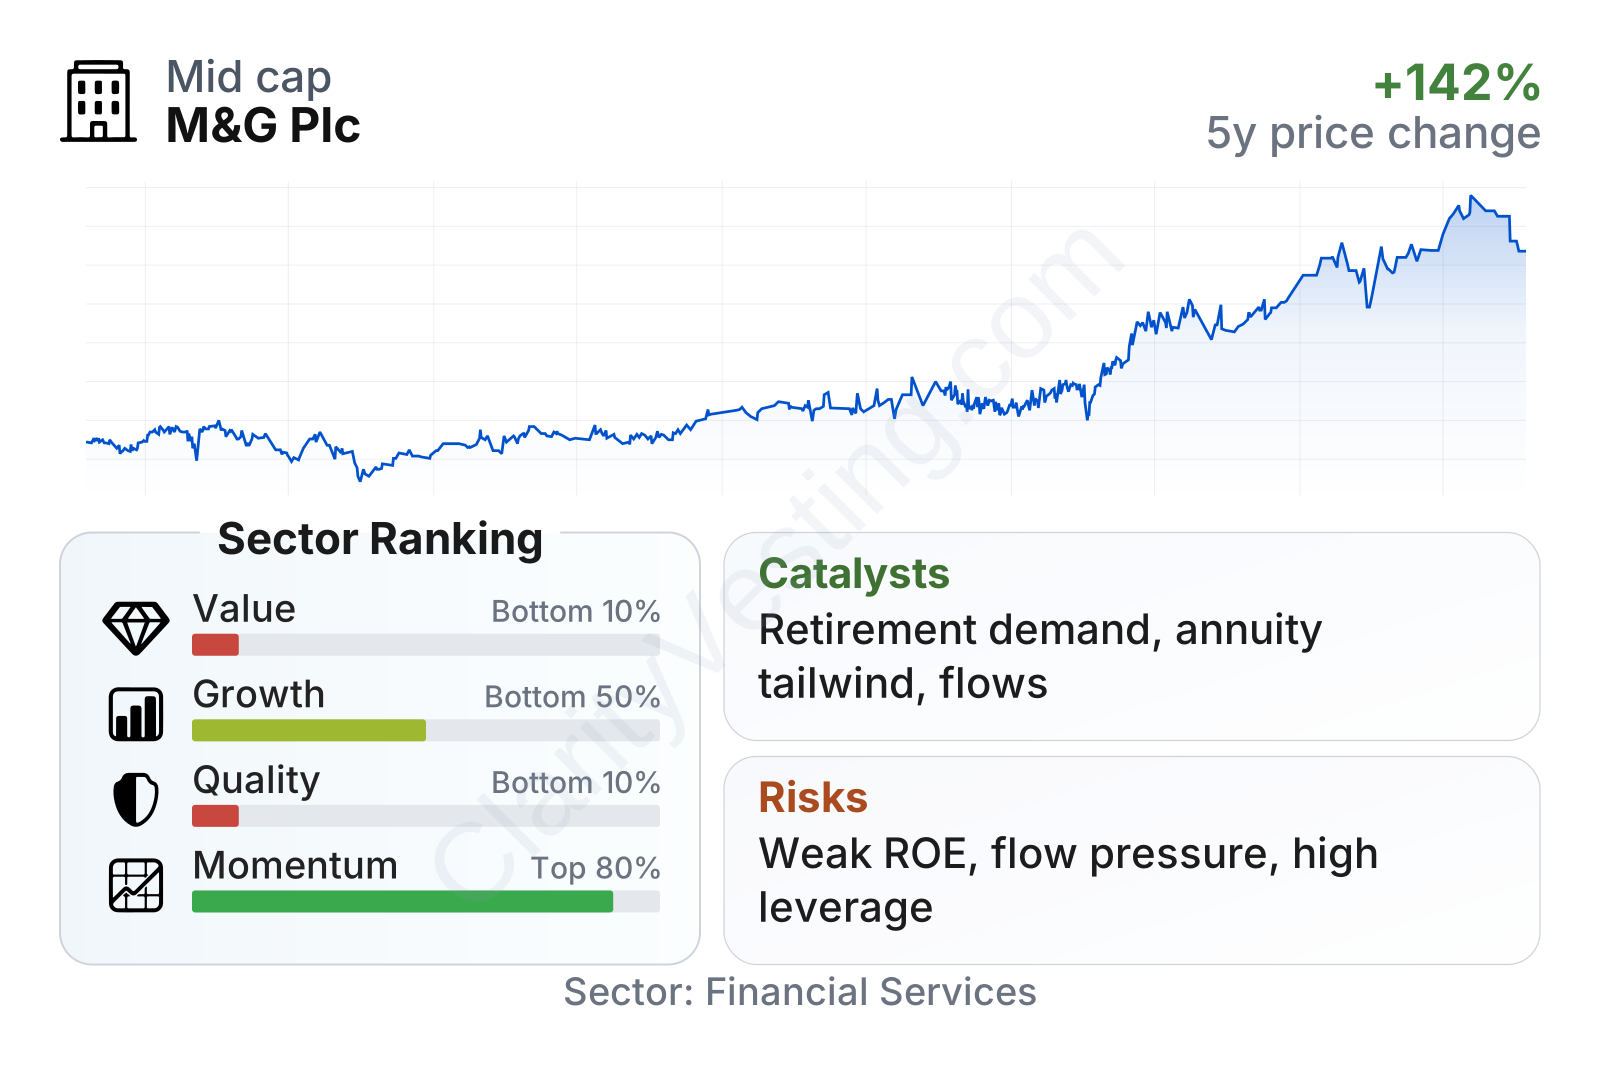
M&G currently screens as a large financial company with relatively strong recent share-price momentum, but weaker rankings on growth, quality, and traditional value measures versus the broader financial sector. The combination is unusual: market performance has improved materially over the last one to three years, yet profitability and balance-sheet efficiency still look softer than many peers. Free cash flow yield and dividend yield stand out positively, while price-to-book has moved well above the sector median, suggesting the market has already re-rated the shares despite mixed fundamentals.
Beta is close to 1, which means the stock has historically moved in a way that is not far from the wider market. Market capitalization places M&G in a meaningful size bracket within listed financials, large enough to matter competitively, but still much smaller than the global giants in insurance and asset management.
Growth
M&G operates in parts of finance that have durable long-term demand. Retirement income, long-term savings, and professionally managed investments remain supported by aging populations, pension reform, and the continued shift of savings responsibility toward individuals. Private markets, fixed income solutions, and income-oriented products are also areas where client demand has stayed relevant. In that sense, the company is in a sector with structural support, even if near-term growth can be inconsistent.
The company’s strategy broadly makes sense for that backdrop. Management has been emphasizing capital-light growth areas such as asset management, wealth, and retirement solutions, while also trying to use its insurance balance sheet more efficiently. For M&G, that matters because capital-light activities usually deserve higher valuation multiples than mature insurance books. If the group can gather more third-party assets, improve retention, and grow in higher-fee products such as private markets and specialized fixed income, its earnings mix could gradually improve.
There is also a practical catalyst in the current interest-rate environment. Higher rates can support annuity economics and investment income, while income-focused investment products often become more attractive to savers when bond yields are compelling. That does not remove market risk, but it can make several M&G product lines easier to position.
The earnings trend shows why the market remains divided. M&G moved from a loss per share in 2024 to positive earnings in the more recent period shown, which points to improving profitability. That improvement is encouraging, but one positive step does not erase the broader record of volatility. For long-term analysis, the main question is whether this is the start of a steadier earnings base or just another cyclical rebound.
Book value per share has trended downward over the last several years, even with occasional rebounds. For a financial company, that matters because book value often reflects cumulative capital strength and the ability to absorb shocks. A falling book value does not automatically signal a broken business, especially in insurance-heavy groups, but it does mean growth has not translated into compounding net worth per share.
Recent company updates have pointed to ongoing efforts around simplification, cost discipline, and selective expansion in higher-growth product areas. A significant opportunity would be any sustained improvement in net client flows, especially in asset management and retail savings, because that would show the franchise is attracting fresh capital rather than relying mainly on market appreciation or legacy books.
Risks
This article is for informational purposes only and does not constitute financial advice. Some content is AI-generated. See Disclaimer


