Stock Analysis · MetLife Inc (MET)
Overview
MetLife is one of the largest life insurers in the world. The company sells insurance, employee benefits, retirement-related products, and asset management services to individuals, employers, and institutions. Its business is spread across the United States, Asia, Latin America, Europe, the Middle East, and Africa, which gives it a broad customer base and reduces dependence on any single market.
In simple terms, MetLife makes money by collecting insurance premiums, earning fees for managing benefit and retirement products, and investing the large pool of assets it holds to meet future policyholder obligations. Like most insurers, its results depend not only on sales but also on claims experience, investment income, and movements in interest rates and capital markets.
Based on MetLife’s recent annual reporting structure, revenue is broadly supported by these business lines, listed from largest to smallest on an adjusted earnings basis rather than pure accounting revenue, which is often distorted in insurance by investment-market movements:
- Group Benefits: about 26% of adjusted earnings. This includes employee benefits sold through employers, such as dental, disability, life, vision, and paid family and medical leave products.
- Retirement and Income Solutions: about 24%. This includes pension risk transfer, annuities, stable value products, and retirement income offerings.
- Asia: about 22%. This business includes life, accident and health, savings, and employee benefits products across key Asian markets.
- Latin America: about 12%. This includes life, accident and health, property and casualty, and pension-related offerings in the region.
- Europe, the Middle East and Africa: about 9%. This segment serves both group and individual customers across multiple countries.
- MetLife Holdings: about 7%. This is a run-off business made up largely of older products the company is managing for value rather than actively expanding.
That mix matters because it shows MetLife is not just a traditional life insurer. A meaningful share of earnings comes from workplace benefits and retirement solutions, two areas that tend to be more stable and strategically important as populations age and employers continue outsourcing benefit administration.
The long-term financial pattern also shows that revenue has generally moved higher over the last several years, while profitability has been more uneven. Sales expanded from the low-$60 billion range in 2021 to above $77 billion in 2025, but net income did not rise in a straight line. That is common in insurance, where reserve adjustments, claims patterns, and investment results can create volatility from year to year.
Over the last five years, the business appears to have grown its top line while margins remained more variable. Gross profit improved materially by 2025, but operating expenses also rose sharply, which helps explain why earnings did not fully track revenue growth.
Key Figures
| Metric | Value | Sector ⓘ |
|---|---|---|
| Date | Oct 10, 2026 | |
| Context | ||
| Sector | Financial Services | |
| Industry | Insurance - Life | |
| Market Cap ⓘ | $60.87B | |
| Beta ⓘ | 0.78 | |
Value (Cheapness) | ||
| P/E Ratio ⓘ | 18.35 | 12.38 |
| P/B Ratio ⓘ | 2.41 | 1.23 |
| FCF Yield ⓘ | 27.23% | 10.23% |
| Dividend Yield ⓘ | 2.36% | 3.01% |
| EBIT / EV ⓘ | 6.52% | 8.08% |
| PEG ⓘ | 0.51 | |
Growth (Business expansion) | ||
| Revenue Growth ⓘ | 10.50% | 9.50% |
| RPS Growth (5Y CAGR) ⓘ | 12.30% | 12.21% |
| EPS Growth (5Y CAGR) ⓘ | -8.76% | -9.62% |
| BVPS Growth (5Y CAGR) ⓘ | -14.19% | 4.98% |
| Margin Growth (5Y Trend) ⓘ | -7.47% | -4.07% |
| FCF Growth (5Y CAGR) ⓘ | 1.65% | 4.76% |
| DPS Growth (5Y CAGR) ⓘ | 4.85% | 8.79% |
Quality (Business durability) | ||
| ROIC (Latest) ⓘ | 8.24% | 9.35% |
| ROE (Latest) ⓘ | 12.67% | 13.91% |
| ROA (Latest) ⓘ | 0.49% | 1.53% |
| ROIC (5Y Median) ⓘ | 8.82% | 7.86% |
| ROE (5Y Median) ⓘ | 8.98% | 12.22% |
| ROA (5Y Median) ⓘ | 0.65% | 1.29% |
| Net Debt / EBIT (Latest) ⓘ | -0.45 | 0.99 |
| Net Debt / EBIT (5Y Median) ⓘ | -0.30 | 0.73 |
| Net Debt / EBITDA (Latest) ⓘ | -0.40 | 0.93 |
| Operating Margin (Latest) ⓘ | 6.79% | 22.19% |
| Operating Margin (5Y Median) ⓘ | 9.38% | 24.30% |
| Debt to Equity (Latest) ⓘ | 74.26% | 60.24% |
| Profit Margin (Latest) ⓘ | 4.57% | 26.49% |
| Free Cash Flow (Latest) ⓘ | $16.57B | |
Momentum (Price trend) | ||
| 3Y Return ⓘ | +73.87% | +88.52% |
| 12M Return (excl. last month) ⓘ | +23.40% | +19.65% |
| 6M Return ⓘ | +34.30% | +6.00% |
| Price vs. 200-Day MA ⓘ | +18.19% | +3.61% |
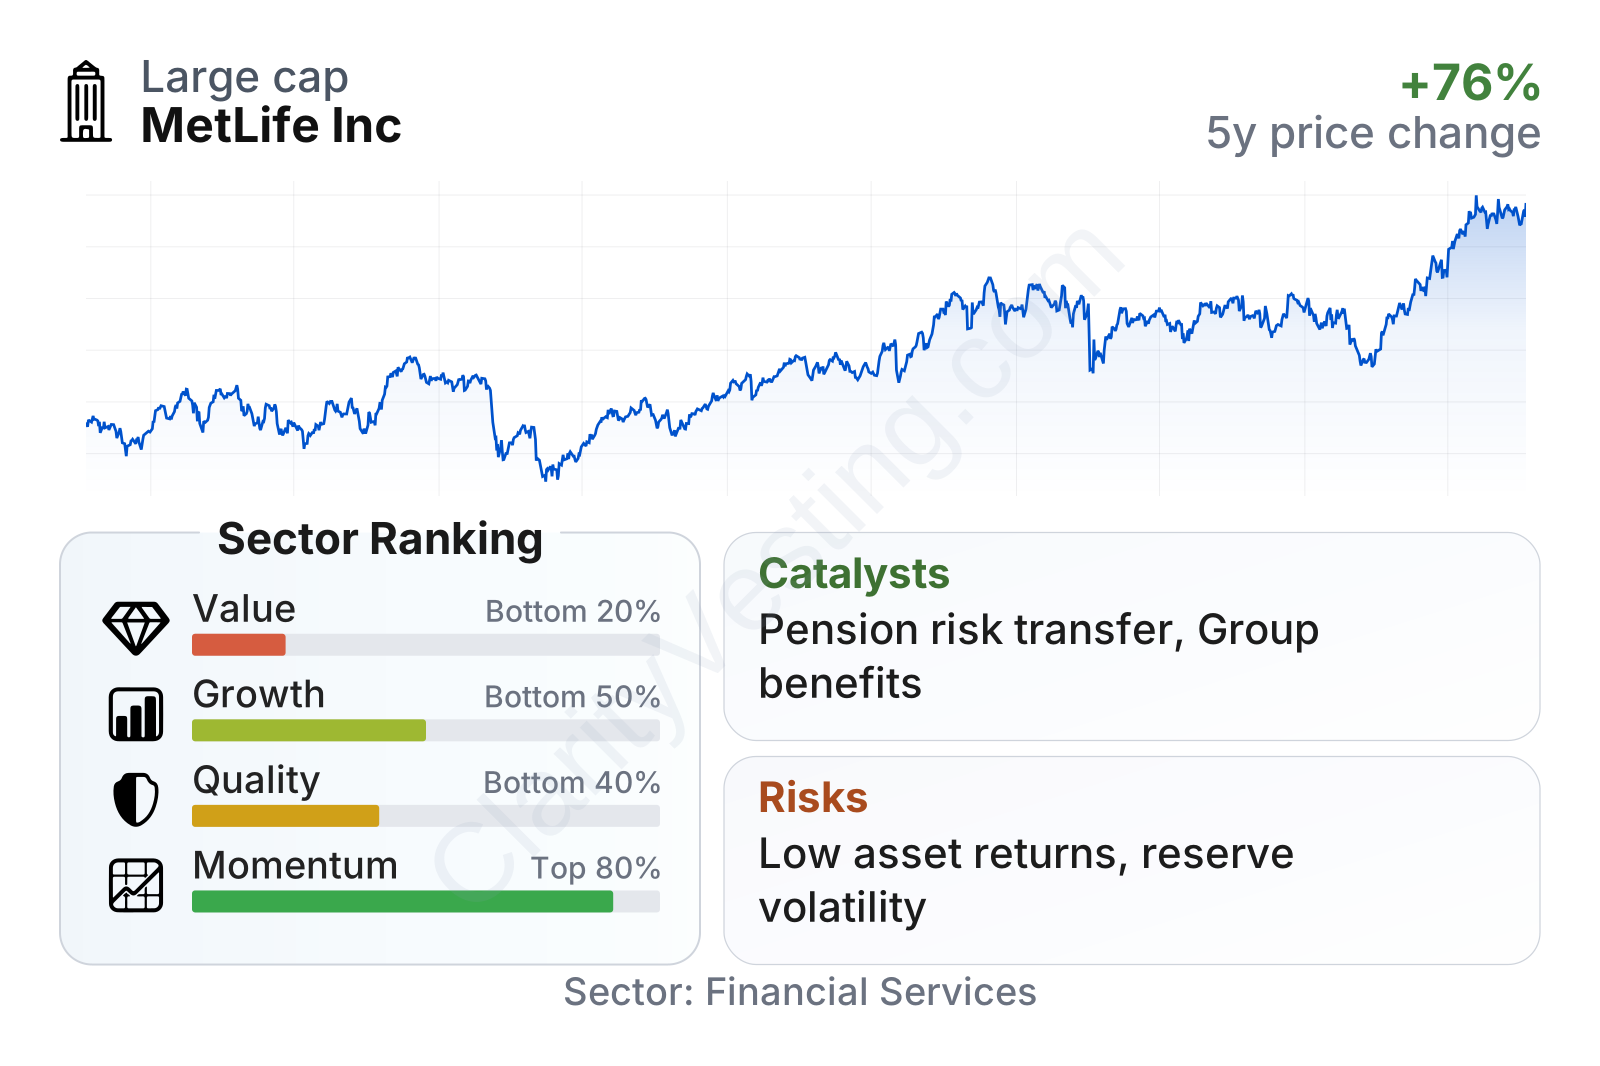
MetLife is a very large insurer with a market value in the tens of billions of dollars and a stock that has been less volatile than the broader market, as reflected by a beta below 1. In the factor breakdown, the strongest area is recent price momentum, while value, growth, and quality look more mixed. The company stands out for strong free cash flow generation and a low PEG ratio, but its price-to-earnings and price-to-book multiples are both above sector medians. Profitability metrics are more average to below average for the group, which suggests the market is placing a premium on balance sheet strength, business mix, and improving operating outlook rather than on exceptional current returns.
The stock price history also shows that MetLife has moved through clear swings but with an overall upward trend since late 2021. The latest phase has been especially strong, with the shares well above their long-term moving average, which points to improving market confidence in the company’s earnings and capital position.
Growth
MetLife operates in parts of the financial sector that benefit from durable long-term demand. Life insurance, workplace benefits, annuities, and pension transfer solutions are supported by aging populations, higher awareness of income protection, and employer demand for outsourced benefits. These are not fast-changing technology markets, but they can produce steady expansion when scale, underwriting discipline, and distribution are well managed.
MetLife’s strategy also fits that environment. The company has been emphasizing capital-light and fee-oriented businesses, especially group benefits, retirement solutions, and selected international markets. That approach makes sense because these businesses can be less balance-sheet intensive than some legacy life products and can produce recurring earnings with lower sensitivity to one-off market shocks.
A notable catalyst is pension risk transfer. Large employers continue moving pension obligations to insurers, and MetLife has been an active participant in that market. This can create sizable blocks of new business and strengthen its retirement platform. Another support is interest rates. Insurers often benefit when they can reinvest at higher yields, provided credit quality remains sound and policyholder behavior stays stable.
Recent operating momentum has also been constructive. Revenue growth around 10% year over year is slightly ahead of the sector median, and recent share-price strength suggests the market has been reacting positively to that trend. Earnings per share have recovered from the weaker 2022-2023 period and have moved back closer to prior highs, although not in a perfectly smooth line.
The earnings path points to a business that has regained traction after a difficult period. The key question for long-term followers is not whether yearly profit will be smooth, because insurance rarely is, but whether the underlying earnings base is gradually becoming larger and more diversified. On that front, the combination of benefits, retirement products, and international operations is a positive sign.
Book value per share gives a more cautious signal. It fell sharply after 2021 and has only partly recovered since then. For an insurer, book value matters because it reflects capital strength and the impact of investment-market movements on the balance sheet.
The recent rebound is encouraging, but the longer-term decline means balance sheet growth has not been consistently strong. That makes future capital deployment, underwriting quality, and reserve discipline especially important in judging whether growth is translating into lasting shareholder value.
Risks
This article is for informational purposes only and does not constitute financial advice. Some content is AI-generated. See Disclaimer