Stock Analysis · Mesoblast Ltd (MEOBF)
Overview
Mesoblast Ltd is a biotechnology company focused on cell therapies built from mesenchymal lineage cells. In simple terms, it develops living-cell treatments designed to reduce inflammation and help damaged tissue repair itself. The company has spent years working on severe inflammatory diseases and other conditions with limited treatment options, with a particular focus on products that can be manufactured at scale rather than custom-made for each patient.
Its business model is still transitioning from development stage to commercial stage. Historically, Mesoblast generated only modest revenue from royalties, licensing, and early commercial activity. That changed sharply after the U.S. launch progress of Ryoncil, its allogeneic cell therapy for steroid-refractory acute graft-versus-host disease in children. Based on the latest annual results, revenue is now much more concentrated in product sales than it was a few years ago.
The main sources of revenue appear to be:
- Product sales: about 94% of FY2026 revenue — primarily revenue associated with Ryoncil commercialization in the United States.
- Royalties: about 4% — recurring payments tied to partnered products or regional commercial arrangements.
- Licensing and other revenue: about 2% — milestone-related, collaboration, or miscellaneous operating income.
This mix matters because it shows Mesoblast is no longer relying almost entirely on research partnerships. Revenue is becoming more commercial, although it is still heavily dependent on one lead product and one core indication at this stage.
Over the last several years, the income profile has improved from very low revenue with negative gross profit to a much larger top line and positive gross profit. Even so, operating expenses remain high because the company is still spending heavily on research, regulatory work, and commercialization.
The financial flow shows a major inflection in FY2026: revenue rose dramatically and gross profit turned strongly positive. The trade-off is that research and selling costs also expanded, which is typical when a biotech moves from development into launch mode.
Key Figures
| Metric | Value | Sector ⓘ |
|---|---|---|
| Date | Oct 24, 2026 | |
| Context | ||
| Sector | Healthcare | |
| Industry | Biotechnology | |
| Market Cap ⓘ | $1.71B | |
| Beta ⓘ | 0.86 | |
Value (Cheapness) | ||
| P/E Ratio ⓘ | N/A | 25.42 |
| P/B Ratio ⓘ | 3.01 | 3.08 |
| FCF Yield ⓘ | -2.47% | 3.12% |
| Dividend Yield ⓘ | N/A | 1.85% |
| EBIT / EV ⓘ | -2.45% | 0.56% |
| PEG ⓘ | 0.14 | |
Growth (Business expansion) | ||
| Revenue Growth ⓘ | 390.70% | 7.50% |
| RPS Growth (5Y CAGR) ⓘ | 58.68% | 8.60% |
| EPS Growth (5Y CAGR) ⓘ | -55.15% | -17.73% |
| BVPS Growth (5Y CAGR) ⓘ | -11.88% | 3.72% |
| Margin Growth (5Y Trend) ⓘ | N/A | -0.57% |
| FCF Growth (5Y CAGR) ⓘ | -9.27% | 0.96% |
| DPS Growth (5Y CAGR) ⓘ | N/A | 6.69% |
Quality (Business durability) | ||
| ROIC (Latest) ⓘ | N/A | 3.17% |
| ROA (Latest) ⓘ | -7.39% | 2.98% |
| ROIC (5Y Median) ⓘ | -8.12% | 4.56% |
| ROA (5Y Median) ⓘ | -12.99% | 1.87% |
| Net Debt / EBIT (Latest) ⓘ | N/A | 1.34 |
| Net Debt / EBIT (5Y Median) ⓘ | N/A | 1.86 |
| Net Debt / EBITDA (Latest) ⓘ | N/A | 1.00 |
| Net Debt / Assets ⓘ | 3.16% | 5.06% |
| EBITDA / Interest ⓘ | N/A | 9.55 |
| Operating Margin (Latest) ⓘ | -41.75% | 9.25% |
| Operating Margin (5Y Median) ⓘ | -792.80% | 7.33% |
| Debt to Equity (Latest) ⓘ | 22.40% | 26.68% |
| Profit Margin (Latest) ⓘ | -47.82% | 3.34% |
| Free Cash Flow (Latest) ⓘ | -$42.36M | |
Momentum (Price trend) | ||
| 3Y Return ⓘ | +373.80% | +51.61% |
| 12M Return (excl. last month) ⓘ | +31.03% | +19.90% |
| 6M Return ⓘ | -22.35% | +10.10% |
| Price vs. 200-Day MA ⓘ | -20.28% | +6.44% |
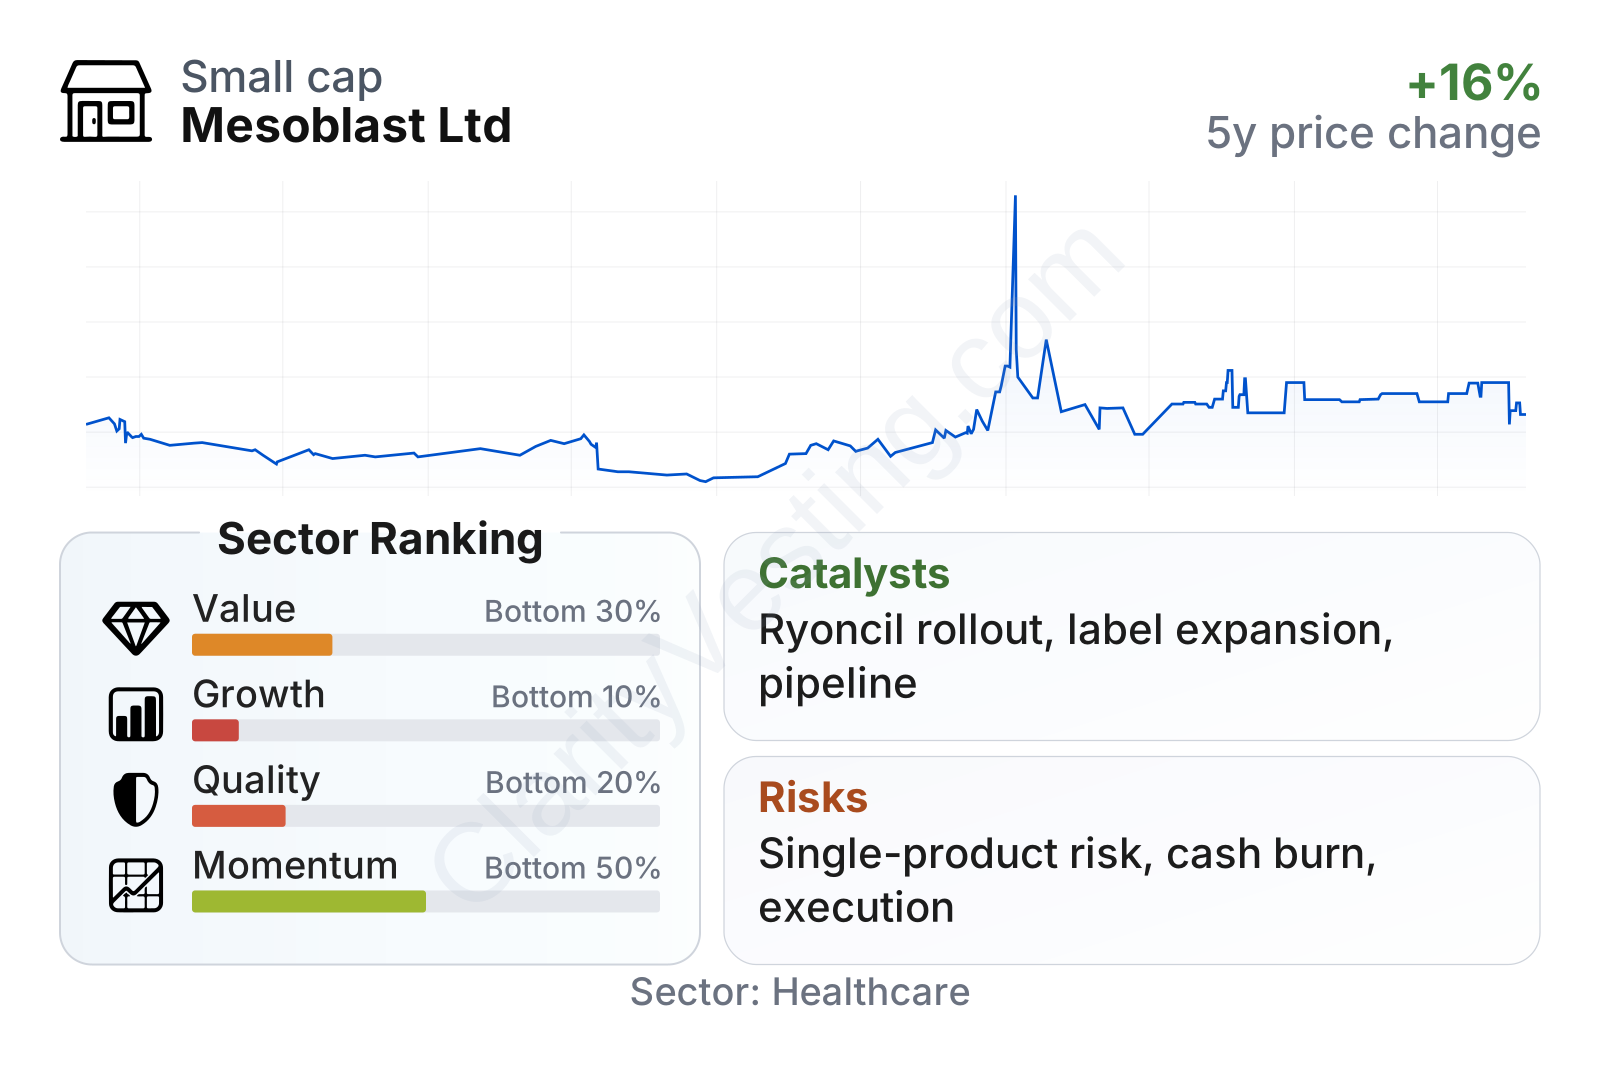
Mesoblast sits in the biotechnology segment of healthcare, which helps explain why some traditional valuation measures are less informative than they would be for a mature profitable company. The market value is now in the mid-cap range, and the stock’s recent price performance has been much stronger than the sector median over both the last three years and the more recent 6- to 12-month periods.
The table points to a business with mixed characteristics. On one hand, revenue growth and share-price momentum stand out. On the other hand, value, quality, and profitability measures remain weak versus the broader healthcare peer group. The company also does not pay a dividend, and free cash flow is still negative.
Growth
Mesoblast operates in a part of healthcare with long-term structural tailwinds. Cell therapy and regenerative medicine address diseases where conventional drugs often fail, especially in immune-mediated and severe inflammatory conditions. If a therapy shows durable benefit in hard-to-treat patients, the commercial value can be meaningful because pricing is usually high and competition is often limited at launch.
The company’s strategy is coherent: start with a narrowly defined, high-need indication where clinical benefit may be easier to demonstrate, then use the same underlying cell platform to pursue additional diseases. That can be an efficient path if manufacturing, regulatory, and physician adoption experience from one product supports future launches.
The revenue trend has changed dramatically. After a period of contraction, growth accelerated sharply from 2025 into 2026, reflecting the step-up from small legacy revenue streams to meaningful product revenue. That kind of jump can create a very different business profile, although the key question is whether the new revenue base is durable and expandable rather than a one-time launch effect.
Cash generation has not yet caught up with revenue growth. Free cash flow remains negative, but the losses are less severe than in some earlier periods. For a commercial-stage biotech, this is an important transition point: strong sales growth matters, but over time the market usually looks for evidence that each additional dollar of revenue is moving the company closer to self-funding operations.
A major catalyst is the continued rollout of Ryoncil in the United States following its regulatory progress. For Mesoblast, this is more than a single product event. It is proof that the company can move from years of development into actual commercial execution. Additional catalysts include broader treatment adoption, reimbursement progress, physician familiarity, and any expansion into further indications using the same cell-therapy platform.
Recent company communications have also kept attention on the broader pipeline, including inflammatory and cardiovascular programs. Those programs matter because they could eventually reduce dependence on one marketed asset. Still, near-term growth is likely to be judged mostly through Ryoncil uptake and the company’s ability to convert demand into sustainable recurring sales.
Risks
This article is for informational purposes only and does not constitute financial advice. Some content is AI-generated. See Disclaimer


