Stock Analysis · Medpace Holdings Inc (MEDP)
Overview
Medpace Holdings is a contract research organization, usually called a CRO. In simple terms, it helps drug, biotechnology, and medical device companies run clinical trials and move products through the development and regulatory process. Its work can cover trial design, selecting research sites, managing patient enrollment, handling data, laboratory services, regulatory support, and post-approval activities. Medpace is especially focused on small and mid-sized biotech clients, although it also works with larger pharmaceutical and device companies.
The business model is mainly service-based. Clients hire Medpace to manage complex research programs that would be expensive and difficult to build internally. Revenue is typically recognized over the life of those contracts, so backlog and new business awards matter a lot for future sales visibility.
Based on company filings, Medpace reports revenue largely as one operating stream rather than many separate business lines. The most useful way to think about its revenue is by the services included in that stream:
- Clinical development services: approximately 85% to 90% — project management, trial monitoring, site management, data handling, biostatistics, medical writing, pharmacovigilance, and regulatory support.
- Laboratory and other support services: approximately 10% to 15% — central laboratory work, imaging, and specialized support tied to clinical studies.
Geographically, Medpace runs a global platform, with operations in North America, Europe, and Asia-Pacific. That broad footprint matters because many modern trials recruit patients across several countries, especially in oncology, rare disease, metabolic disease, cardiology, and other specialized areas where Medpace has built expertise.
The financial profile has improved meaningfully over the last several years. Revenue has risen steadily, while operating income and net income have expanded faster than sales, showing that scale has been helping margins.
Over the past five years, revenue has climbed from a little above $1.1 billion to roughly $2.5 billion, while net income has increased from under $200 million to more than $450 million. That combination points to a business that has not only grown, but also converted a larger share of revenue into profit.
Key Figures
| Metric | Value | Sector ⓘ |
|---|---|---|
| Date | Oct 17, 2026 | |
| Context | ||
| Sector | Healthcare | |
| Industry | Diagnostics & Research | |
| Market Cap ⓘ | $17.21B | |
| Beta ⓘ | 1.18 | |
Value (Cheapness) | ||
| P/E Ratio ⓘ | 35.81 | 24.79 |
| P/B Ratio ⓘ | 41.67 | 3.08 |
| FCF Yield ⓘ | 4.26% | 3.15% |
| Dividend Yield ⓘ | N/A | 1.94% |
| EBIT / EV ⓘ | 3.49% | 0.57% |
| PEG ⓘ | 2.93 | |
Growth (Business expansion) | ||
| Revenue Growth ⓘ | 17.20% | 7.45% |
| RPS Growth (5Y CAGR) ⓘ | 29.68% | 8.61% |
| EPS Growth (5Y CAGR) ⓘ | 3.94% | -17.81% |
| BVPS Growth (5Y CAGR) ⓘ | -11.44% | 3.72% |
| Margin Growth (5Y Trend) ⓘ | 3.76% | -0.62% |
| FCF Growth (5Y CAGR) ⓘ | 30.51% | 1.04% |
| DPS Growth (5Y CAGR) ⓘ | N/A | 6.77% |
Quality (Business durability) | ||
| ROIC (Latest) ⓘ | 108.19% | 3.24% |
| ROA (Latest) ⓘ | 25.80% | 3.01% |
| ROIC (5Y Median) ⓘ | 56.91% | 4.60% |
| ROA (5Y Median) ⓘ | 18.80% | 1.89% |
| Net Debt / EBIT (Latest) ⓘ | -0.61 | 1.34 |
| Net Debt / EBIT (5Y Median) ⓘ | -0.66 | 1.84 |
| Net Debt / EBITDA (Latest) ⓘ | -0.58 | 1.00 |
| Net Debt / Assets ⓘ | -17.43% | 5.45% |
| EBITDA / Interest ⓘ | N/A | 9.64 |
| Operating Margin (Latest) ⓘ | 21.13% | 9.27% |
| Operating Margin (5Y Median) ⓘ | 19.57% | 7.38% |
| Debt to Equity (Latest) ⓘ | 33.22% | 28.58% |
| Profit Margin (Latest) ⓘ | 17.67% | 3.59% |
| Free Cash Flow (Latest) ⓘ | $733.51M | |
Momentum (Price trend) | ||
| 3Y Return ⓘ | +164.93% | +42.80% |
| 12M Return (excl. last month) ⓘ | +24.99% | +18.50% |
| 6M Return ⓘ | +21.22% | +7.57% |
| Price vs. 200-Day MA ⓘ | +19.52% | +5.12% |
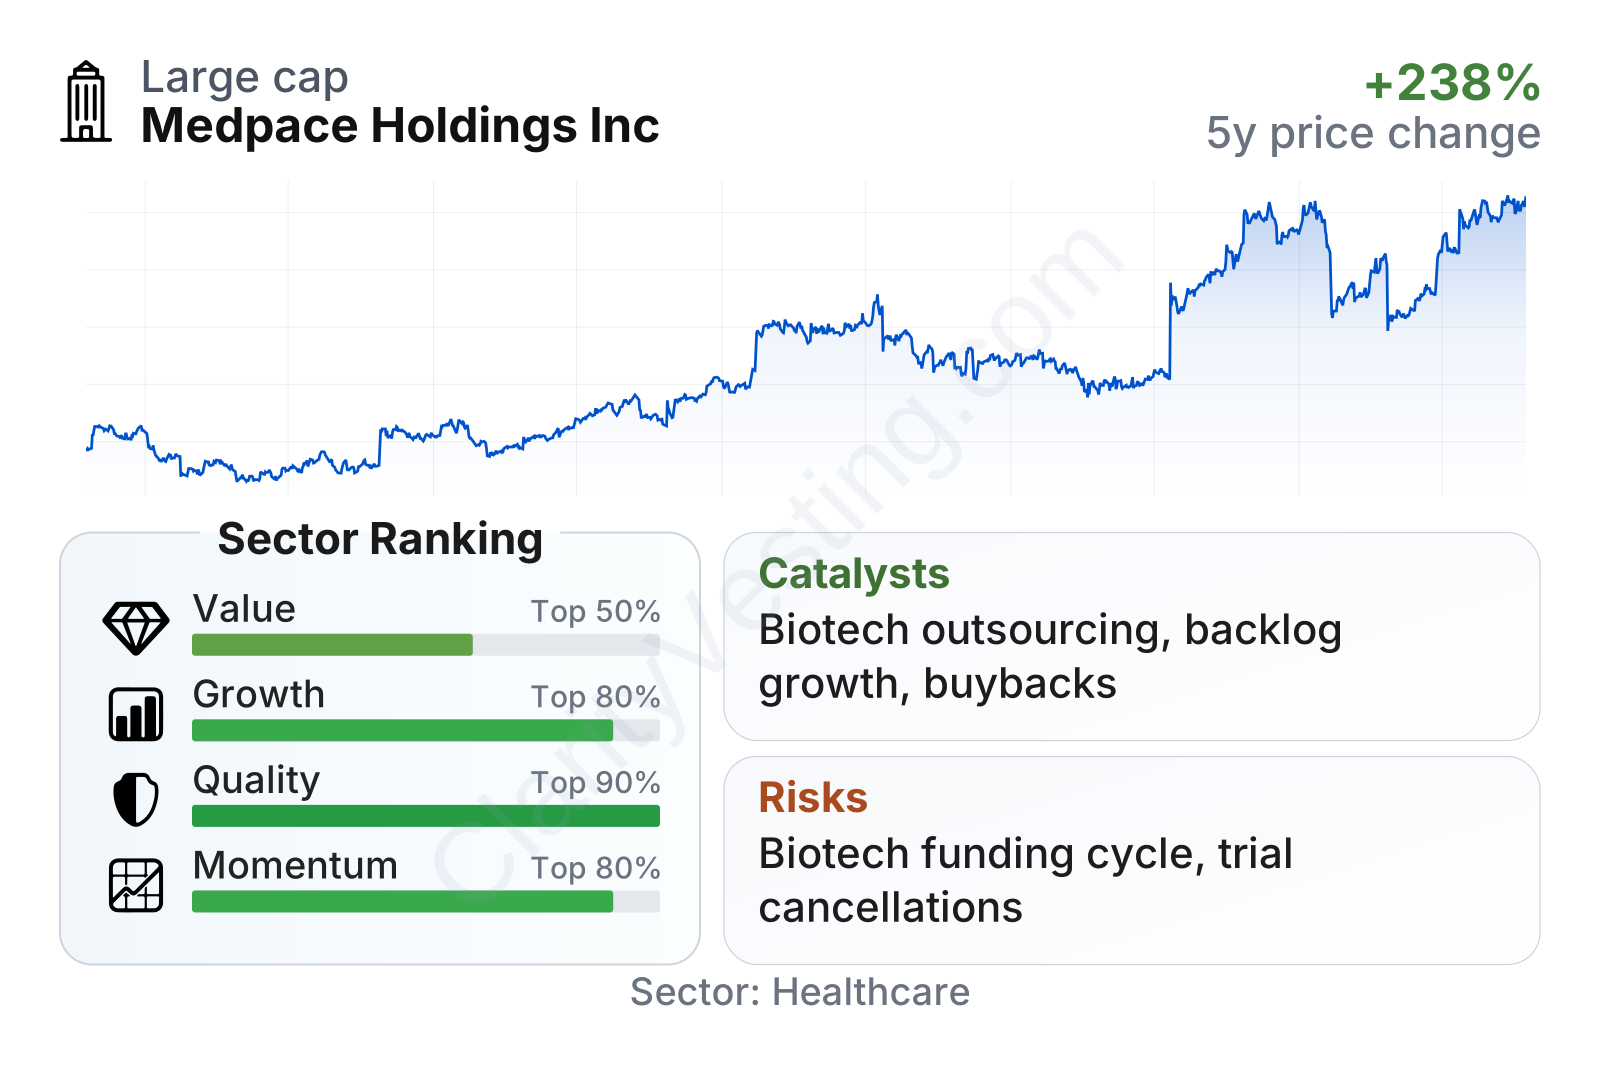
Medpace stands out for strong business quality and above-average growth within healthcare services. Profitability metrics are well ahead of the sector median, cash generation is solid, and the balance sheet remains conservative despite some quarter-to-quarter swings in leverage. The valuation is not low on earnings multiples, but the company’s free cash flow profile and returns on capital help explain why the market assigns it a premium.
The stock’s multi-year performance has also been strong, although the path has not been smooth. There have been sharp advances and pullbacks, which is common for companies exposed to biotech funding cycles and clinical development activity.
Growth
Medpace operates in a sector with long-term structural support. Drug development has become more outsourced over time because clinical trials are expensive, highly regulated, and increasingly global. Smaller biotech firms in particular often rely on CRO partners rather than building full in-house trial infrastructure. That trend supports demand for specialized providers that can manage trials from early planning to final submission.
Medpace’s strategy is relatively clear and coherent. It emphasizes a full-service model, therapeutic specialization, disciplined project selection, and deep relationships with emerging biopharma clients. That positioning can be attractive because smaller clients often need broader support and may outsource a larger share of trial activity than large pharmaceutical companies. If those clients advance more compounds into later-stage studies, Medpace can potentially expand with them over time.
Recent revenue growth has cooled from the very high levels seen in 2022 and 2023, but it remains healthy. After slowing through 2024, growth reaccelerated during 2025 and stayed positive in 2026. That pattern suggests demand did not disappear; instead, activity appears to have normalized and then improved again.
Cash generation is another important growth signal. Free cash flow has moved up sharply over the last several years, reaching the high hundreds of millions of dollars on a trailing basis. That gives Medpace room to invest in staff, technology, and capacity while still preserving financial flexibility.
A notable catalyst is the continued need for outsourcing in complex trial areas such as oncology, rare disease, and metabolic conditions. These programs tend to require specialized execution and international site networks, which can favor experienced operators. Another catalyst is the company’s backlog-driven model: when contract awards build and project cancellations stay under control, future revenue often becomes more visible.
Recent company communications have also highlighted continued demand from biotech customers and ongoing share repurchases. While buybacks do not create operating growth by themselves, they can support per-share results when paired with strong cash flow and disciplined capital allocation.
Risks
This article is for informational purposes only and does not constitute financial advice. Some content is AI-generated. See Disclaimer


