Stock Analysis · MDU Resources Group Inc (MDU)
Overview
MDU Resources Group Inc. is a regulated energy delivery company focused mainly on natural gas and electric utility operations in parts of the northern and mountain states. After reshaping its portfolio over the past few years, the company is much more concentrated than it used to be, with its investment case now tied primarily to rate-regulated utility assets rather than a broader mix of construction materials and services businesses.
Its utility operations serve residential, commercial, and industrial customers through regulated local distribution and electric systems. In a regulated model, revenue is driven largely by customer demand, approved rates, infrastructure investment, and service territory growth rather than by fully open-market pricing. That usually makes results steadier than in cyclical industrial businesses, although weather, regulation, and capital spending still matter a great deal.
Based on the company’s recent annual reporting structure, revenue is mainly generated from the following sources:
- Natural gas distribution and related services: approximately 70% to 80% of total revenue. This includes retail natural gas sales, transportation, distribution charges, and other customer service revenues across regulated service territories.
- Electric utility operations: approximately 20% to 30% of total revenue. This covers generation, transmission, and distribution of electricity to retail customers, with earnings shaped by rate cases and investment recovery.
- Other and non-core activities: a small residual share of revenue, depending on period and reporting classification.
The business mix has become simpler, which can make the company easier to understand: regulated utility earnings, long-lived infrastructure, and returns that depend heavily on capital investment approved by regulators. The revenue profile over recent years shows a smaller company after portfolio changes, followed by stabilization around utility operations, while earnings remain positive but somewhat uneven.
The company’s recent revenue base appears relatively stable after the strategic reset, but net income has been more volatile than revenue. That points to a business where allowed returns, financing costs, operating efficiency, and timing of regulatory recovery are especially important.
Key Figures
| Metric | Value | Sector ⓘ |
|---|---|---|
| Date | Oct 17, 2026 | |
| Context | ||
| Sector | Utilities | |
| Industry | Utilities - Regulated Gas | |
| Market Cap ⓘ | $3.92B | |
| Beta ⓘ | 0.36 | |
Value (Cheapness) | ||
| P/E Ratio ⓘ | 19.83 | 17.28 |
| P/B Ratio ⓘ | 1.34 | 1.51 |
| FCF Yield ⓘ | -8.95% | 0.65% |
| Dividend Yield ⓘ | 3.00% | 3.77% |
| EBIT / EV ⓘ | 5.18% | 5.01% |
| PEG ⓘ | 2.36 | |
Growth (Business expansion) | ||
| Revenue Growth ⓘ | 6.90% | 6.10% |
| RPS Growth (5Y CAGR) ⓘ | -14.47% | 3.87% |
| EPS Growth (5Y CAGR) ⓘ | -30.43% | -11.30% |
| BVPS Growth (5Y CAGR) ⓘ | -5.19% | 4.23% |
| Margin Growth (5Y Trend) ⓘ | 6.67% | 3.57% |
| FCF Growth (5Y CAGR) ⓘ | N/A | -8.84% |
| DPS Growth (5Y CAGR) ⓘ | -11.17% | 4.84% |
Quality (Business durability) | ||
| ROIC (Latest) ⓘ | 5.62% | 6.53% |
| ROA (Latest) ⓘ | 2.64% | 3.20% |
| ROIC (5Y Median) ⓘ | 5.44% | 5.95% |
| ROA (5Y Median) ⓘ | 3.96% | 2.75% |
| Net Debt / EBIT (Latest) ⓘ | 7.60 | 7.13 |
| Net Debt / EBIT (5Y Median) ⓘ | 7.88 | 7.23 |
| Net Debt / EBITDA (Latest) ⓘ | 4.63 | 4.31 |
| Net Debt / Assets ⓘ | 32.82% | 38.42% |
| EBITDA / Interest ⓘ | 4.56 | 4.58 |
| Operating Margin (Latest) ⓘ | 18.20% | 20.83% |
| Operating Margin (5Y Median) ⓘ | 17.00% | 20.08% |
| Debt to Equity (Latest) ⓘ | 88.04% | 137.69% |
| Profit Margin (Latest) ⓘ | 10.75% | 11.37% |
| Free Cash Flow (Latest) ⓘ | -$350.91M | |
Momentum (Price trend) | ||
| 3Y Return ⓘ | +90.70% | +52.37% |
| 12M Return (excl. last month) ⓘ | +18.53% | +8.84% |
| 6M Return ⓘ | -14.53% | -3.95% |
| Price vs. 200-Day MA ⓘ | -9.05% | -0.79% |
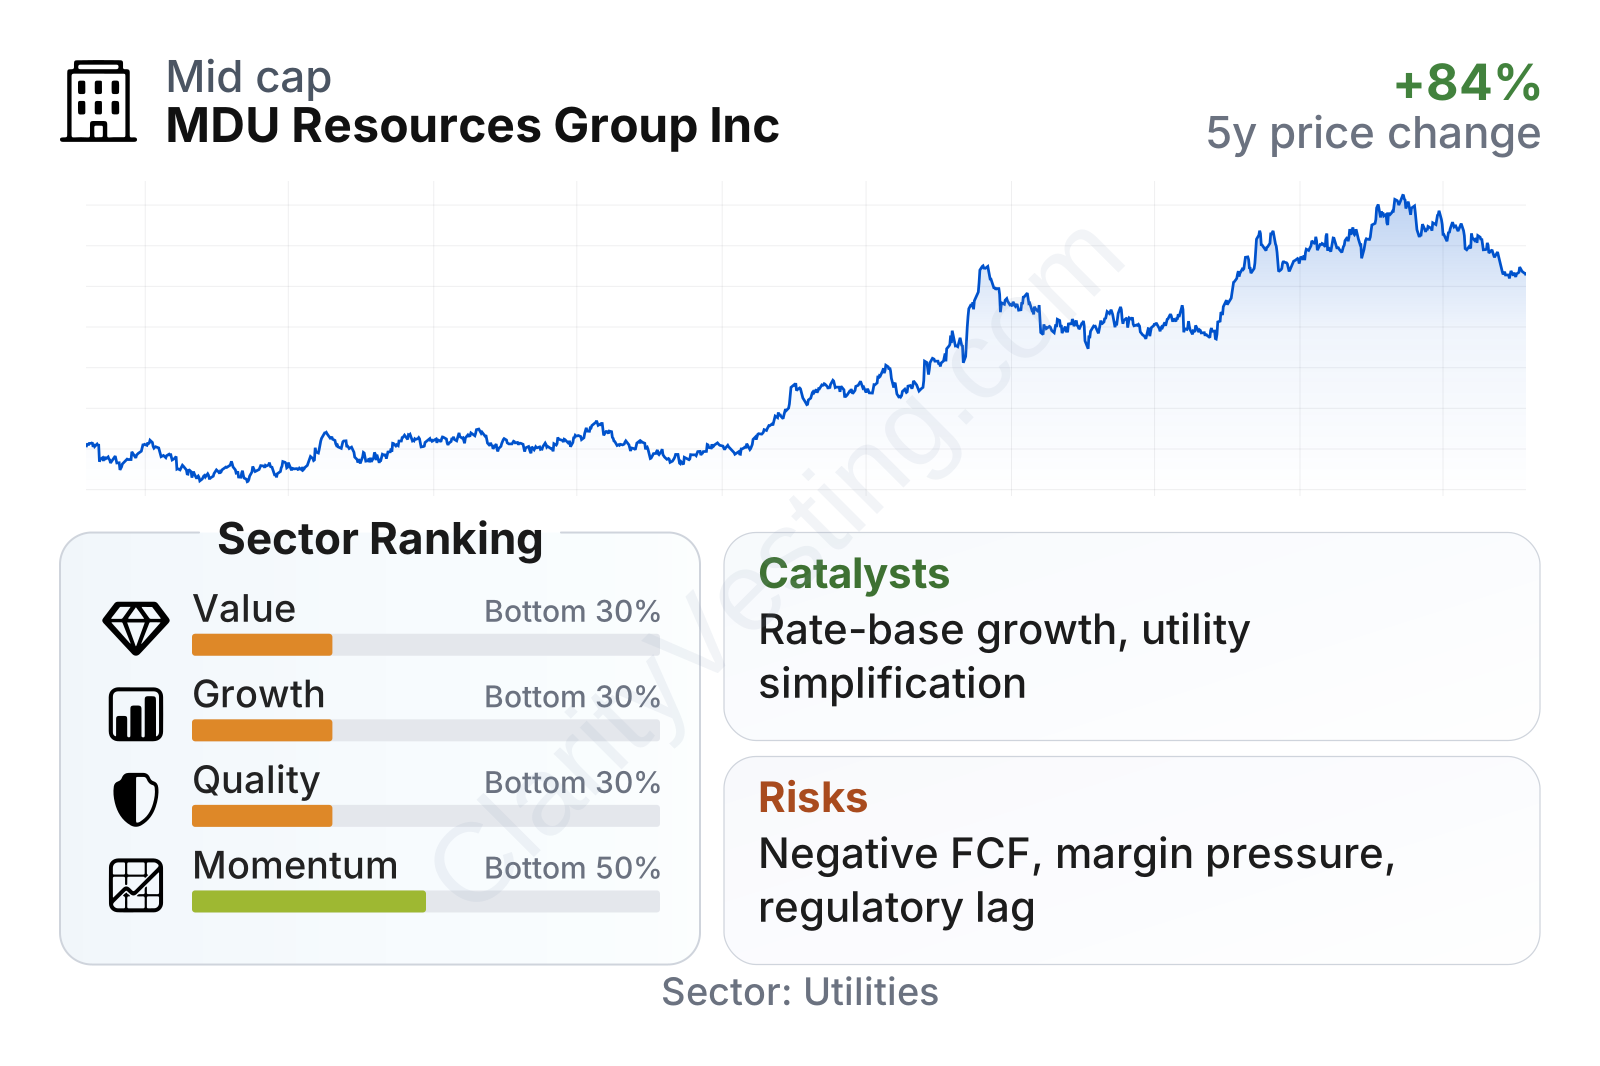
MDU is a mid-sized utility company with a relatively low beta of about 0.38, which suggests the stock has been less volatile than the broader equity market. In the factor table, the company ranks in the bottom 30% of its sector for value, growth, and quality, while momentum is somewhat better at top 60%. That combination points to a stock that has enjoyed a strong re-rating in recent years, even though core business quality and long-term growth metrics still look mixed compared with many regulated utility peers.
The share price trend has been strong over the last three years, but the valuation multiple has also risen sharply. At the same time, free cash flow remains weak, which limits how much of that market optimism is backed by internally generated cash in the near term.
Growth
MDU operates in a sector that is generally considered defensive rather than fast-growing, but that does not mean growth is absent. Regulated utilities can expand through customer additions, grid and pipeline upgrades, safety investments, renewable and reliability projects, and periodic rate increases approved by regulators. In MDU’s case, that framework still offers a path to measured growth, especially because utilities are often allowed to earn returns on capital invested into their rate base.
The company’s narrower focus on utility operations makes strategic sense for future growth because it aligns the business with more stable, regulated earnings streams. That said, the long-term growth record is not especially strong yet. Revenue per share fell sharply after the portfolio reshaping and has only partly stabilized since then.
This pattern is important: recent year-over-year revenue growth is slightly ahead of the sector median, but the five-year revenue-per-share trend remains negative. In other words, current momentum is better than the longer historical record, so the key question is whether the utility-focused version of MDU can now build a cleaner and more durable expansion path.
One of the more important catalysts is the company’s utility capital program. In regulated utilities, infrastructure spending can become future earnings growth if commissions allow recovery through rates. Grid modernization, system reliability projects, and customer growth in its service territories can all support that process. A simpler corporate structure can also help management concentrate capital and execution on fewer businesses.
Cash generation, however, deserves close attention.
Free cash flow has swung between positive and negative territory and is currently negative on a trailing basis, around $351 million below zero. For utilities, negative free cash flow is not unusual during heavy investment periods, but it does mean growth depends on continued access to debt, equity, or both. That does not invalidate the growth plan, but it does make financing conditions a meaningful part of the outlook.
Recent company updates have continued to emphasize regulated utility investment, customer demand, and operational execution rather than transformative acquisitions. That is consistent with a lower-drama, infrastructure-led growth model. The opportunity is real, but it is likely to be gradual rather than explosive.
Risks
This article is for informational purposes only and does not constitute financial advice. Some content is AI-generated. See Disclaimer


