Stock Analysis · PT Medco Energi Internasional Tbk (MDCOY)
Overview
PT Medco Energi Internasional Tbk is an Indonesian energy company with activities across upstream oil and gas, power generation, and some mining exposure through listed and operating subsidiaries. In simple terms, it explores for and produces oil and natural gas, sells electricity from power assets, and also has an economic interest in copper and gold through Amman Mineral Internasional. The business is concentrated in Indonesia but also includes assets in other parts of Southeast Asia and the Middle East.
For long-term analysis, the most important point is that Medco is not a pure one-line business. It combines commodity production with contracted power operations, which gives it a broader earnings base than many smaller exploration and production companies. The tradeoff is that the structure is more complex and debt-funded than simpler peers.
Based on recent company reporting, its revenue mix is led by oil and gas, while power is the second main operating contributor. Mining-related value is meaningful at the group level, but it is less straightforward to map into recurring consolidated revenue in the same way as the other two segments because of ownership structure and reporting presentation. A practical way to think about the company is:
- Oil and gas: approximately 75% to 85% of consolidated revenue. This includes crude oil, natural gas, and related upstream sales from producing fields.
- Power: approximately 15% to 25% of consolidated revenue. This includes electricity sales from gas-fired, geothermal, solar, and other power assets, often supported by long-term contracts.
- Other and mining-related contributions: limited in reported consolidated revenue, but strategically important through equity interests and asset value exposure.
That mix matters because oil and gas usually drives short-term profit swings, while power can add more stability. Over the last several years, the group has remained primarily an upstream energy company even as it expanded its power platform.
The multiyear earnings flow shows a business that lifted revenue strongly from 2021 to 2025, but with more pressure on financing costs and a clear drop in net income in 2025. Operating profit stayed sizeable, yet interest expense kept rising, which helps explain why bottom-line performance has been much more volatile than revenue.
Key Figures
| Metric | Value | Sector ⓘ |
|---|---|---|
| Date | Oct 17, 2026 | |
| Context | ||
| Sector | Energy | |
| Industry | Oil & Gas E&P | |
| Market Cap ⓘ | $1.73B | |
| Beta ⓘ | 0.01 | |
Value (Cheapness) | ||
| P/E Ratio ⓘ | 11.48 | 15.44 |
| P/B Ratio ⓘ | 86.97 | 1.73 |
| FCF Yield ⓘ | 28.28% | 8.20% |
| Dividend Yield ⓘ | 4.99% | 3.59% |
| EBIT / EV ⓘ | 15.45% | 7.46% |
| PEG ⓘ | N/A | |
Growth (Business expansion) | ||
| Revenue Growth ⓘ | 27.30% | 26.90% |
| RPS Growth (5Y CAGR) ⓘ | 17.92% | 6.90% |
| EPS Growth (5Y CAGR) ⓘ | N/A | -15.73% |
| BVPS Growth (5Y CAGR) ⓘ | 12.48% | 6.07% |
| Margin Growth (5Y Trend) ⓘ | -26.06% | 0.58% |
| FCF Growth (5Y CAGR) ⓘ | 4.45% | 1.86% |
| DPS Growth (5Y CAGR) ⓘ | 131.78% | 16.79% |
Quality (Business durability) | ||
| ROIC (Latest) ⓘ | 10.67% | 11.40% |
| ROA (Latest) ⓘ | 1.47% | 6.06% |
| ROIC (5Y Median) ⓘ | N/A | 10.30% |
| ROA (5Y Median) ⓘ | 4.68% | 5.42% |
| Net Debt / EBIT (Latest) ⓘ | 3.87 | 1.64 |
| Net Debt / EBIT (5Y Median) ⓘ | 2.83 | 1.83 |
| Net Debt / EBITDA (Latest) ⓘ | 3.83 | 1.08 |
| Net Debt / Assets ⓘ | 36.10% | 17.29% |
| EBITDA / Interest ⓘ | 2.35 | 9.64 |
| Operating Margin (Latest) ⓘ | 31.59% | 16.27% |
| Operating Margin (5Y Median) ⓘ | 42.70% | 20.39% |
| Debt to Equity (Latest) ⓘ | N/A | 54.76% |
| Profit Margin (Latest) ⓘ | 13.26% | 8.82% |
| Free Cash Flow (Latest) ⓘ | $489.47M | |
Momentum (Price trend) | ||
| 3Y Return ⓘ | N/A | +67.38% |
| 12M Return (excl. last month) ⓘ | N/A | +49.19% |
| 6M Return ⓘ | +8.20% | +7.07% |
| Price vs. 200-Day MA ⓘ | +4.25% | +9.56% |
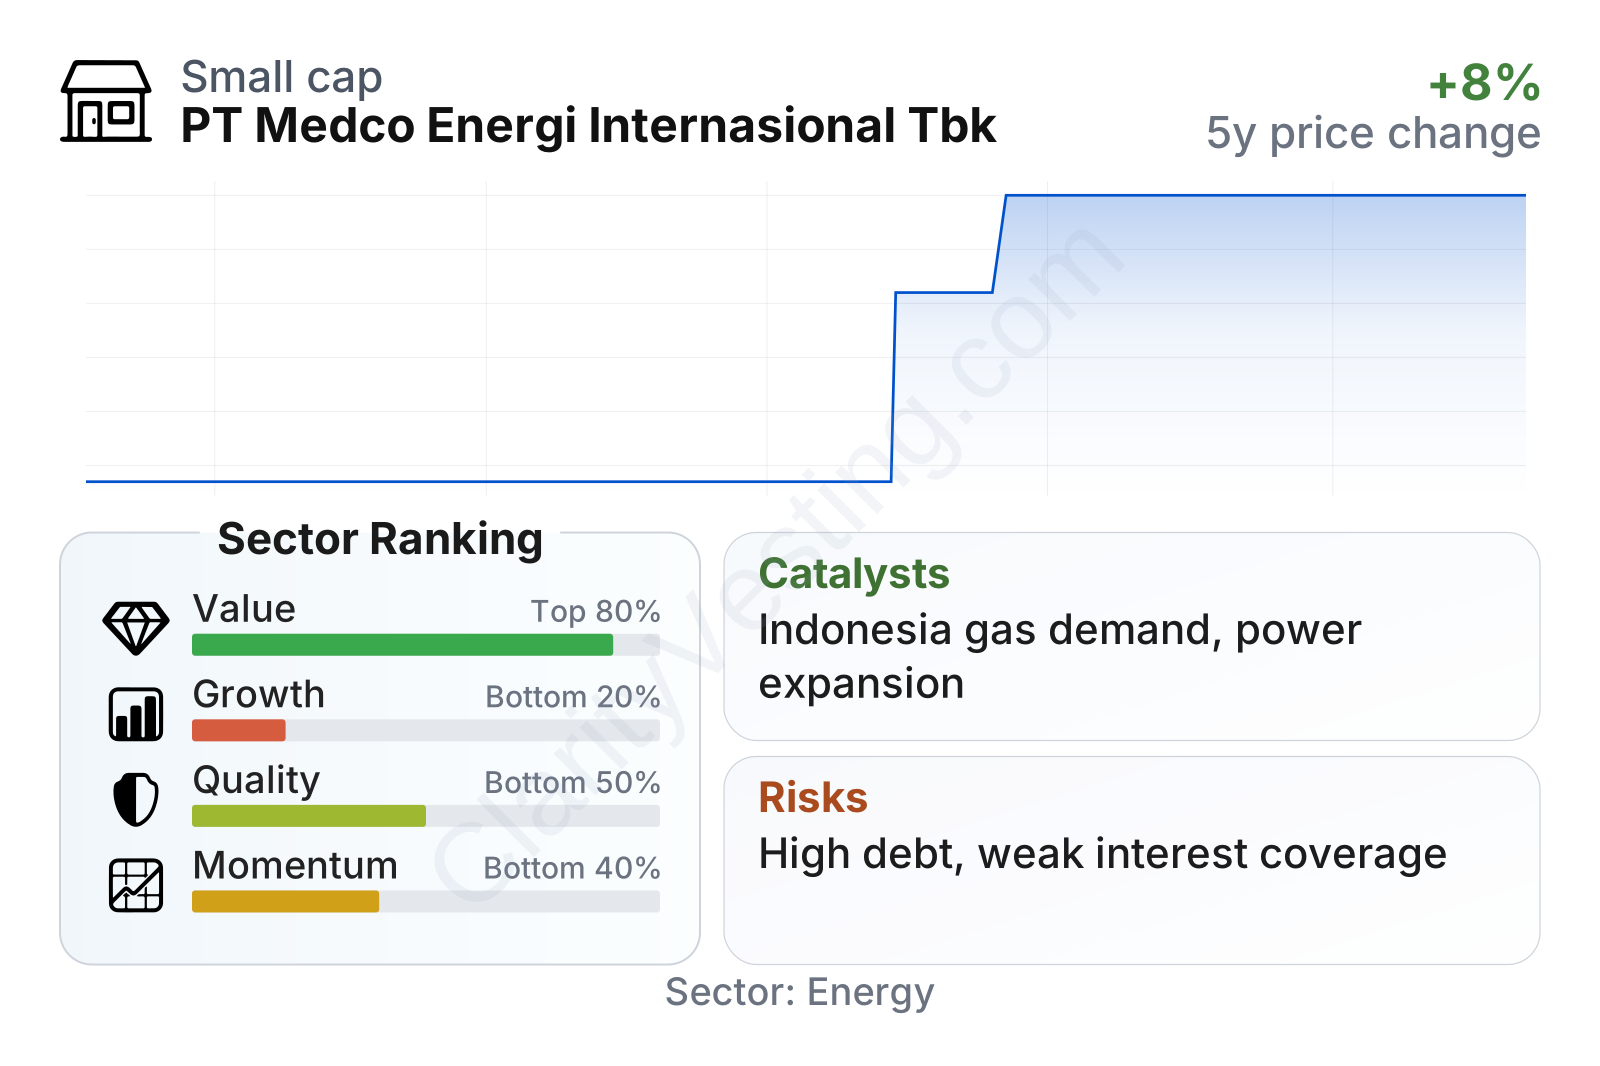
The recent share-price trend has been mildly positive, but the bigger message in the metrics is the contrast between cash generation and balance-sheet pressure. On valuation measures tied to earnings and cash flow, Medco screens better than many sector peers: its earnings multiple is below the sector median, free-cash-flow yield is far above typical levels, and its dividend yield is also above the median. Profitability at the operating level is solid, with margins stronger than many peers.
At the same time, quality metrics are held back by leverage. Net debt relative to EBIT and EBITDA is much higher than the sector median, and interest coverage is much thinner. That means the company appears inexpensive on several headline measures, but part of that discount reflects a financing burden that reduces flexibility if energy prices weaken or project execution slips.
Growth indicators are mixed. Revenue has compounded well over five years, book value per share has grown, and free cash flow has also increased. However, operating margin has trended down from unusually strong levels, which suggests recent growth has not translated into steadily improving efficiency. In short, Medco looks like a cash-generative but leveraged mid-sized energy company rather than a clean high-growth compounder.
Growth
Medco operates in sectors that should remain relevant for years, but the outlook differs by segment. Oil and gas demand is still supported in Asia, especially natural gas, which is often treated as a transition fuel because it can displace coal in power generation. Power generation, particularly geothermal and other lower-carbon sources, adds exposure to a more durable long-term theme: rising electricity demand in developing economies.
The company’s strategy broadly makes sense for future growth because it is not relying on only one commodity. Its upstream portfolio provides cash flow when production and prices cooperate, while the power business can anchor the group with longer-duration contracted assets. This combination is useful in Indonesia and the wider region, where industrialization, electrification, and energy security remain major priorities.
A notable catalyst is Medco’s continued positioning in domestic gas and power. Indonesia has been pushing for better use of local energy resources, and companies with existing infrastructure, customer relationships, and permitting experience are in a better place to capture that demand than new entrants. Medco also benefits from already being scaled enough to participate in meaningful field developments and independent power projects.
Another growth angle is portfolio depth. The company has built exposure across conventional hydrocarbons, geothermal, and other power assets rather than concentrating entirely on mature oil fields. That does not remove cyclicality, but it can improve resilience over a full commodity cycle. If gas demand strengthens and power additions stay on track, this mix could support steadier operating performance than a pure upstream model.
Recent corporate developments have also kept attention on capital allocation, refinancing, and asset optimization. For a company like Medco, successful refinancing or debt reduction can matter almost as much as production growth because it directly affects how much operating profit reaches shareholders after interest expense.
Risks
This article is for informational purposes only and does not constitute financial advice. Some content is AI-generated. See Disclaimer


