Stock Analysis · Mednax Inc (MD)
Overview
Mednax Inc. is a physician-led healthcare services company focused on specialty medical care in the United States. After several years of restructuring and asset sales, the business is now centered mainly on anesthesia services delivered through American Anesthesiology, with a smaller but still meaningful presence in radiology through Pediatrix Medical Group. The company works with hospitals, surgery centers, and other care settings, providing doctors and clinical teams that are typically reimbursed by commercial insurers, government programs such as Medicare and Medicaid, and patients.
That means Mednax is no longer the broad pediatric and women’s services group it once was. Today, its investment case depends much more on whether it can run a narrower specialty platform efficiently, keep clinicians staffed, negotiate sustainable contracts, and convert revenue into cash.
The latest business mix appears concentrated in two main revenue streams, with anesthesia clearly dominant. Based on recent company reporting and segment disclosures, the revenue base can be summarized approximately as follows:
- Anesthesia services: about 80% to 85% of revenue. This includes anesthesia staffing and related physician services for hospitals, ambulatory surgery centers, and procedural settings.
- Radiology services: about 15% to 20% of revenue. This includes diagnostic and pediatric radiology interpretations and related physician services.
The revenue model is relatively straightforward: Mednax earns professional fees for medical services performed by affiliated clinicians. In practice, this makes volume, payer mix, reimbursement rates, labor costs, and contract retention especially important.
The company’s financial profile also shows a noticeable improvement in the latest period after a difficult stretch. Revenue has been fairly stable around the $2 billion level in recent years, but profitability was pressured in 2023 and 2024 before rebounding strongly in 2025 and into 2026. That pattern suggests the recent thesis is less about rapid top-line expansion and more about margin repair, disciplined operations, and cash generation.
The long-term trend visible here is a business with limited revenue growth but a much better earnings outcome recently, helped by lower cost of revenue and improved operating leverage. That matters because Mednax’s current profile looks increasingly driven by execution rather than pure expansion.
Key Figures
| Metric | Value | Sector ⓘ |
|---|---|---|
| Date | Oct 17, 2026 | |
| Context | ||
| Sector | Healthcare | |
| Industry | Medical Care Facilities | |
| Market Cap ⓘ | $2.20B | |
| Beta ⓘ | 0.61 | |
Value (Cheapness) | ||
| P/E Ratio ⓘ | 12.95 | 24.79 |
| P/B Ratio ⓘ | 2.57 | 3.08 |
| FCF Yield ⓘ | 10.41% | 3.15% |
| Dividend Yield ⓘ | N/A | 1.94% |
| EBIT / EV ⓘ | 10.53% | 0.57% |
| PEG ⓘ | 0.24 | |
Growth (Business expansion) | ||
| Revenue Growth ⓘ | 4.00% | 7.45% |
| RPS Growth (5Y CAGR) ⓘ | 0.37% | 8.61% |
| EPS Growth (5Y CAGR) ⓘ | -12.33% | -17.81% |
| BVPS Growth (5Y CAGR) ⓘ | -0.53% | 3.72% |
| Margin Growth (5Y Trend) ⓘ | 2.52% | -0.62% |
| FCF Growth (5Y CAGR) ⓘ | 54.37% | 1.04% |
| DPS Growth (5Y CAGR) ⓘ | -24.30% | 6.77% |
Quality (Business durability) | ||
| ROIC (Latest) ⓘ | 12.80% | 3.24% |
| ROA (Latest) ⓘ | 8.07% | 3.01% |
| ROIC (5Y Median) ⓘ | 5.41% | 4.60% |
| ROA (5Y Median) ⓘ | 2.62% | 1.89% |
| Net Debt / EBIT (Latest) ⓘ | 1.36 | 1.34 |
| Net Debt / EBIT (5Y Median) ⓘ | 3.33 | 1.84 |
| Net Debt / EBITDA (Latest) ⓘ | 1.24 | 1.00 |
| Net Debt / Assets ⓘ | 15.54% | 5.45% |
| EBITDA / Interest ⓘ | 9.46 | 9.64 |
| Operating Margin (Latest) ⓘ | 12.51% | 9.27% |
| Operating Margin (5Y Median) ⓘ | 6.14% | 7.38% |
| Debt to Equity (Latest) ⓘ | 70.37% | 28.58% |
| Profit Margin (Latest) ⓘ | 8.96% | 3.59% |
| Free Cash Flow (Latest) ⓘ | $228.96M | |
Momentum (Price trend) | ||
| 3Y Return ⓘ | +121.02% | +42.80% |
| 12M Return (excl. last month) ⓘ | +61.07% | +18.50% |
| 6M Return ⓘ | +25.10% | +7.57% |
| Price vs. 200-Day MA ⓘ | +18.12% | +5.12% |
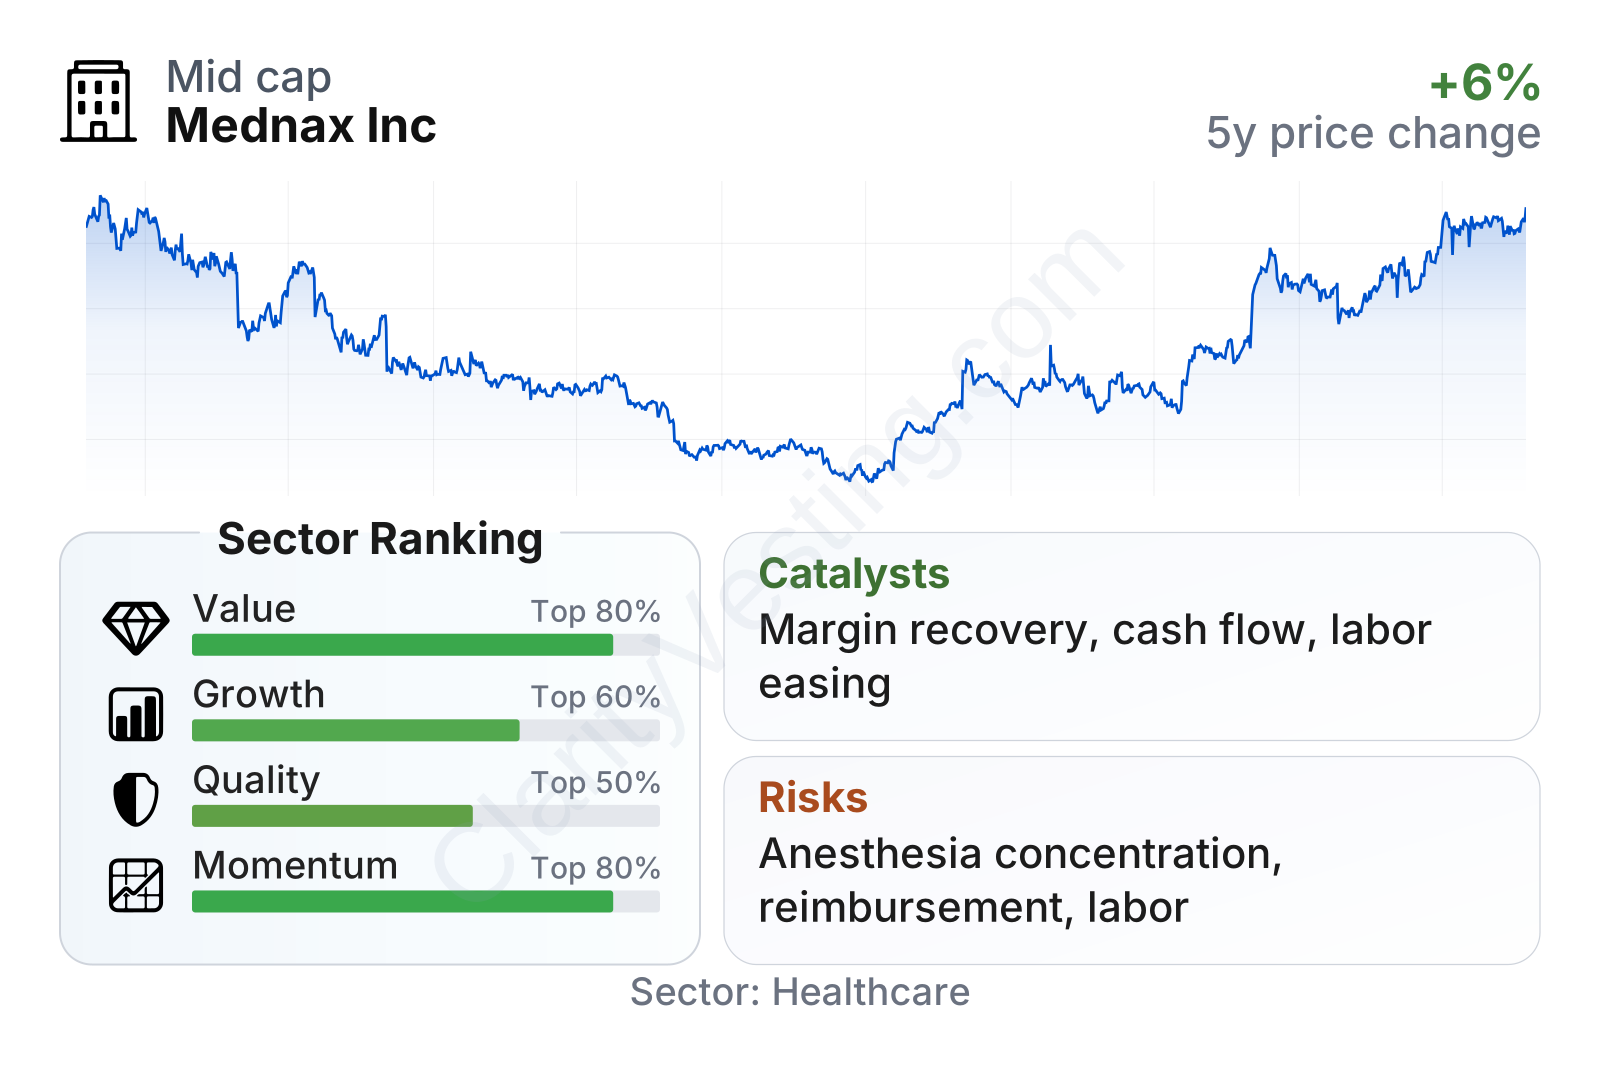
Mednax is a mid-sized healthcare company with a market value a little above $2 billion and a stock that has been less volatile than the broader market, as shown by its beta below 1. The factor profile is mixed but improving: valuation metrics look stronger than much of the healthcare sector, quality is around the middle to better half of the group, and growth is only moderate. The most striking point is cash generation, with free cash flow yield well above the sector median and returns on capital and assets also ahead of many peers. In short, the current profile looks more like an operational recovery with healthy cash conversion than a classic high-growth healthcare name.
Growth
Mednax operates in parts of healthcare that benefit from durable long-term demand. Anesthesia and radiology are not trendy markets, but they are essential services tied to surgeries, hospital activity, outpatient procedures, imaging demand, and an aging population. Over time, those characteristics support recurring need, even if annual growth is usually steadier than in biotech, medical devices, or software-heavy healthcare businesses.
The more important question is whether Mednax can grow faster than the underlying market. Here, the answer is less obvious. Recent revenue growth has been positive again, running around 4% year over year, but that is still below the sector median. The longer five-year record is modest, showing that this has not been a strong expansion story. What may change sentiment is that margins are improving at the same time revenue has stabilized, which is often more powerful than weak growth paired with weak profitability.
The pattern suggests a company moving out of a contraction phase rather than one entering a high-growth cycle. After negative year-over-year revenue periods in 2025, the return to low-single-digit growth in 2026 indicates some stabilization in volumes, contracts, or pricing.
Strategy-wise, the current approach makes sense for this type of business. Mednax has become more focused, which can simplify operations and management priorities. In physician-services businesses, scale matters, but so does discipline in staffing, scheduling, payer contracting, and local market density. A more concentrated portfolio can help management improve those areas instead of spreading resources across unrelated specialties.
Free cash flow is one of the clearest bright spots. Over the last several years, cash generation has risen sharply, and trailing twelve-month free cash flow is now well above $200 million. For a company of this size, that is meaningful because it creates room for debt reduction, acquisitions, share repurchases, or reinvestment in operations.
The upward trend here is important. It suggests the recent recovery is not just an accounting improvement but is increasingly visible in actual cash. For long-term analysis, that usually carries more weight than a short-term earnings swing.
A potential catalyst is continued normalization in labor conditions. Staffing shortages and clinician wage pressure hurt many provider-service companies in recent years. If recruitment, retention, and use of premium labor continue to improve, Mednax could expand margins further even without strong revenue acceleration. Another possible tailwind is the broader shift toward outpatient and ambulatory procedures, where anesthesia coverage remains essential and efficient provider networks can be valuable partners.
Recent company updates have also highlighted ongoing operational initiatives and a stronger earnings profile versus the weak period seen in 2023 and 2024. That does not guarantee a new growth phase, but it does support the idea that the company has entered a better part of its cycle.
Risks
This article is for informational purposes only and does not constitute financial advice. Some content is AI-generated. See Disclaimer


