Stock Analysis · The Monarch Cement Company (MCEM)
Overview
The Monarch Cement Company is a U.S. building materials producer focused on cement and downstream products used in construction. The company operates a long-established cement plant in Humboldt, Kansas, and serves markets mainly in the central United States. Its business is tied to residential, commercial, industrial, agricultural, and public infrastructure construction, which makes demand sensitive to construction activity but also supported by long-lived local and regional building needs.
Monarch’s revenue base is concentrated in a small number of related activities built around cement production and distribution. Based on the company’s public filings and business description, the main sources of revenue are approximately:
- Cement sales: about 55% to 70% of revenue. This is the core business and includes the manufacture and sale of portland and masonry cement used in ready-mix concrete, roadbuilding, and other construction applications.
- Ready-mixed concrete and concrete products: about 15% to 30% of revenue. This includes concrete sold to construction projects and related downstream products.
- Aggregates, trucking, and other building materials services: about 10% to 20% of revenue. This typically includes crushed stone, sand, transport, and related support services tied to construction activity.
This mix matters because cement usually carries stronger economics than many downstream products, while concrete and transport operations can help Monarch keep customer relationships close to end markets. The business is regional rather than national, which can be an advantage in heavy materials where freight costs are important and customers often value dependable local supply.
Over the last several years, the company’s revenue grew from roughly $212 million in 2021 to about $248 million in 2025, while operating income and gross profit also stayed at relatively healthy levels. Costs of revenue remain the largest expense line, as expected for an energy- and logistics-intensive manufacturer, but the business has preserved unusually strong profitability for its industry.
The broad trend shows a company that has expanded sales over time while keeping operating expenses fairly controlled. Even with some year-to-year fluctuations, profitability has remained notably robust, helped by pricing discipline and a very light interest burden.
Key Figures
| Metric | Value | Sector ⓘ |
|---|---|---|
| Date | Oct 31, 2026 | |
| Context | ||
| Sector | Basic Materials | |
| Industry | Building Materials | |
| Market Cap ⓘ | $1.00B | |
| Beta ⓘ | 0.40 | |
Value (Cheapness) | ||
| P/E Ratio ⓘ | 13.69 | 16.71 |
| P/B Ratio ⓘ | 2.22 | 1.72 |
| FCF Yield ⓘ | 5.75% | 5.78% |
| Dividend Yield ⓘ | 1.26% | 2.17% |
| EBIT / EV ⓘ | 9.37% | 7.05% |
| PEG ⓘ | N/A | |
Growth (Business expansion) | ||
| Revenue Growth ⓘ | 2.80% | 10.85% |
| RPS Growth (5Y CAGR) ⓘ | 4.23% | 4.49% |
| EPS Growth (5Y CAGR) ⓘ | -6.19% | -12.99% |
| BVPS Growth (5Y CAGR) ⓘ | 13.61% | 5.51% |
| Margin Growth (5Y Trend) ⓘ | 5.97% | -1.42% |
| FCF Growth (5Y CAGR) ⓘ | 5.03% | 0.52% |
| DPS Growth (5Y CAGR) ⓘ | 12.91% | 6.02% |
Quality (Business durability) | ||
| ROIC (Latest) ⓘ | 17.64% | 9.28% |
| ROA (Latest) ⓘ | 15.00% | 4.90% |
| ROIC (5Y Median) ⓘ | N/A | 7.76% |
| ROA (5Y Median) ⓘ | 15.73% | 3.88% |
| Net Debt / EBIT (Latest) ⓘ | -0.42 | 1.35 |
| Net Debt / EBIT (5Y Median) ⓘ | -0.76 | 1.70 |
| Net Debt / EBITDA (Latest) ⓘ | -0.33 | 0.93 |
| Net Debt / Assets ⓘ | -7.16% | 12.93% |
| EBITDA / Interest ⓘ | N/A | 12.36 |
| Operating Margin (Latest) ⓘ | 33.75% | 12.74% |
| Operating Margin (5Y Median) ⓘ | 26.66% | 11.87% |
| Debt to Equity (Latest) ⓘ | N/A | 40.30% |
| Profit Margin (Latest) ⓘ | 28.98% | 6.58% |
| Free Cash Flow (Latest) ⓘ | $57.64M | |
Momentum (Price trend) | ||
| 3Y Return ⓘ | +125.85% | +75.47% |
| 12M Return (excl. last month) ⓘ | +22.35% | +22.27% |
| 6M Return ⓘ | +7.31% | -3.22% |
| Price vs. 200-Day MA ⓘ | +2.68% | -2.47% |
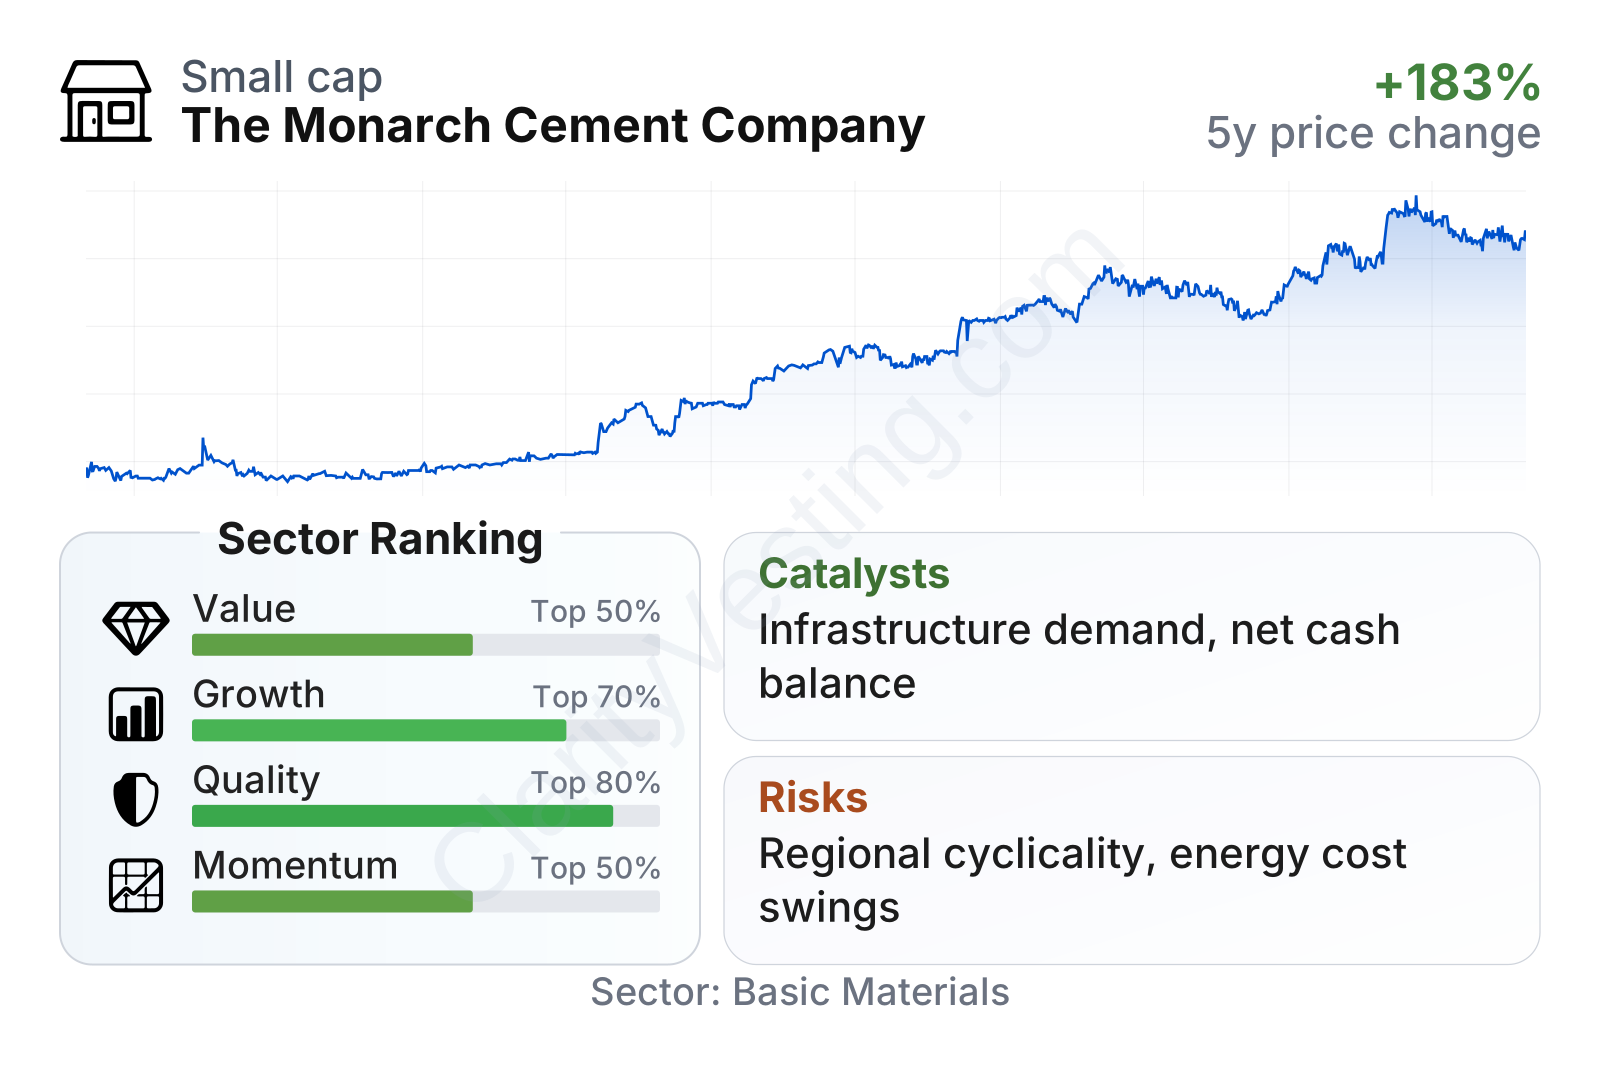
Monarch is a relatively small public company, with a market value around $1 billion, and its shares have shown low sensitivity to broad market swings, reflected in a beta well below 1. The overall profile is unusual for a cyclical materials producer: profitability and balance-sheet quality rank well above much of the sector, while growth is more moderate. Valuation measures are mixed rather than extreme. Earnings-based valuation looks somewhat lower than the sector median, but book value is priced at a premium, which likely reflects the market’s view of Monarch’s strong returns and conservative finances.
The factor breakdown is also telling. Quality ranks near the top of the sector, supported by high returns on capital, high margins, and net cash rather than heavy leverage. Growth ranks weaker than quality because recent revenue expansion has been slower than the typical company in the sector, even though longer-term free cash flow and book value trends have been solid. Momentum sits around the middle to upper half of the group, consistent with the strong multiyear rise in the stock.
Growth
Cement and construction materials are not fast-growing industries in the way software or biotechnology can be, but they are essential industries with durable demand. Over the long term, growth is usually driven by population trends, infrastructure funding, industrial development, housing starts, and pricing power rather than disruptive innovation. In that context, Monarch operates in a sector that can grow steadily over a cycle, especially when public works and regional construction remain active.
Monarch’s strategy appears sensible for that environment. The company is focused on a core product with high transportation costs, which creates natural local market advantages for established plants. It also participates in related downstream activities such as ready-mix concrete and transport, which can help secure demand and improve customer reach. That kind of vertical link is practical in building materials because it ties production more closely to local construction demand.
Revenue growth has not been smooth. The company posted periods of strong expansion, then several weaker or negative comparisons, before returning to positive growth in 2026. That pattern suggests Monarch is influenced by timing, construction demand, and pricing cycles rather than a simple straight-line growth path. The latest year-over-year revenue increase, around 3%, is positive but still below the sector median, so the current growth case rests more on resilience and pricing than on rapid volume expansion.
Free cash flow has improved meaningfully over time, rising from the low-$20 million range to nearly $46 million on a trailing basis in the most recent period shown, while the latest quality metrics place trailing free cash flow around $58 million. That matters because cash generation gives Monarch flexibility for plant investment, dividends, and balance-sheet strength without depending heavily on external financing.
A meaningful catalyst for the company is the broader push to modernize U.S. infrastructure and industrial facilities. Cement remains a basic input for roads, bridges, plants, warehouses, and public construction. If construction activity in Monarch’s regional footprint stays firm, the company could benefit from stable pricing and plant utilization. Another positive element is that producers with existing permitted capacity can be advantaged because building new cement capacity in the U.S. is expensive, time-consuming, and heavily regulated.
Recent public company materials also continue to emphasize steady operations, dividends, and board actions rather than dramatic strategic change. That fits Monarch’s profile as a disciplined regional operator rather than a company chasing aggressive expansion.
Risks
This article is for informational purposes only and does not constitute financial advice. Some content is AI-generated. See Disclaimer


