Stock Analysis · Mitchells & Butlers plc (MBPFF)
Overview
Mitchells & Butlers plc is one of the largest pub and restaurant operators in the United Kingdom. The company runs a nationwide estate of managed venues under well-known brands including Toby Carvery, Harvester, All Bar One, Miller & Carter, Ember Inns, Stonehouse, Premium Country Pubs, Vintage Inns, Nicholson’s, and O’Neill’s. Its business is centered on food, drinks, and hospitality experiences delivered through directly operated locations rather than a heavily franchised model.
For long-term analysis, the most important point is that Mitchells & Butlers is primarily a U.K. consumer spending business tied to eating out, social occasions, and pub traffic. That makes it sensitive to disposable income, wage costs, food inflation, and confidence levels in the British economy, but it also gives the group strong exposure to established brands, recurring local demand, and a large freehold-backed estate.
Revenue is mainly generated from sales within its pubs and restaurants. The company does not provide a simple public split for every revenue stream in the same way some retailers do, but its sales base can be understood broadly as follows:
- Food sales: likely the largest contributor, supported by brands such as Toby Carvery, Harvester, and Miller & Carter, where meals are the main traffic driver.
- Drink sales: a major second revenue source, including alcoholic beverages, soft drinks, and bar-led spending across formats such as O’Neill’s, Nicholson’s, and All Bar One.
- Accommodation and other income: a much smaller contribution, including rooms at selected sites and ancillary venue income.
Brand mix matters because it reduces dependence on a single occasion. The company serves value-focused carvery visits, family dining, premium steakhouse occasions, urban bars, and neighborhood pubs. That diversification helps smooth demand, although nearly all of it still depends on U.K. hospitality conditions.
Recent profit conversion also shows a clearer recovery path than a few years ago. Revenue has moved from roughly £2.2 billion in fiscal 2022 to about £2.7 billion in fiscal 2025, while operating income and net income have improved materially over that period. Interest expense remains meaningful, but the business has become much more profitable as trading normalized and margins rebuilt.
The operating picture has strengthened notably since 2023. Sales have continued to edge higher, but the more important change has been margin recovery: operating income has risen much faster than revenue, suggesting better pricing, improved mix, and tighter cost control. Interest costs are still substantial, yet they are no longer consuming most of the operating progress as they did during weaker periods.
Key Figures
| Metric | Value | Sector ⓘ |
|---|---|---|
| Date | Oct 24, 2026 | |
| Context | ||
| Sector | Consumer Cyclical | |
| Industry | Restaurants | |
| Market Cap ⓘ | $2.23B | |
| Beta ⓘ | 1.23 | |
Value (Cheapness) | ||
| P/E Ratio ⓘ | 9.17 | 17.09 |
| P/B Ratio ⓘ | 0.85 | 1.64 |
| FCF Yield ⓘ | 18.32% | 8.68% |
| Dividend Yield ⓘ | N/A | 2.70% |
| EBIT / EV ⓘ | N/A | 6.69% |
| PEG ⓘ | N/A | |
Growth (Business expansion) | ||
| Revenue Growth ⓘ | 2.50% | 5.60% |
| RPS Growth (5Y CAGR) ⓘ | 24.41% | 9.01% |
| EPS Growth (5Y CAGR) ⓘ | N/A | -17.32% |
| BVPS Growth (5Y CAGR) ⓘ | 5.94% | 5.64% |
| Margin Growth (5Y Trend) ⓘ | 4.75% | -0.17% |
| FCF Growth (5Y CAGR) ⓘ | N/A | 5.02% |
| DPS Growth (5Y CAGR) ⓘ | 53.02% | 10.19% |
Quality (Business durability) | ||
| ROIC (Latest) ⓘ | 12.70% | 12.46% |
| ROA (Latest) ⓘ | 6.58% | 5.50% |
| ROIC (5Y Median) ⓘ | 5.93% | 10.68% |
| ROA (5Y Median) ⓘ | 0.26% | 5.44% |
| Net Debt / EBIT (Latest) ⓘ | 1.78 | 2.16 |
| Net Debt / EBIT (5Y Median) ⓘ | 9.48 | 2.29 |
| Net Debt / EBITDA (Latest) ⓘ | 1.25 | 1.48 |
| Net Debt / Assets ⓘ | 21.37% | 21.74% |
| EBITDA / Interest ⓘ | 4.38 | 9.17 |
| Operating Margin (Latest) ⓘ | 12.08% | 9.08% |
| Operating Margin (5Y Median) ⓘ | 7.42% | 9.56% |
| Debt to Equity (Latest) ⓘ | 47.89% | 75.99% |
| Profit Margin (Latest) ⓘ | 6.70% | 5.30% |
| Free Cash Flow (Latest) ⓘ | $409.19M | |
Momentum (Price trend) | ||
| 3Y Return ⓘ | +59.62% | +19.94% |
| 12M Return (excl. last month) ⓘ | +8.99% | -4.14% |
| 6M Return ⓘ | +21.70% | -3.03% |
| Price vs. 200-Day MA ⓘ | +17.63% | -0.66% |
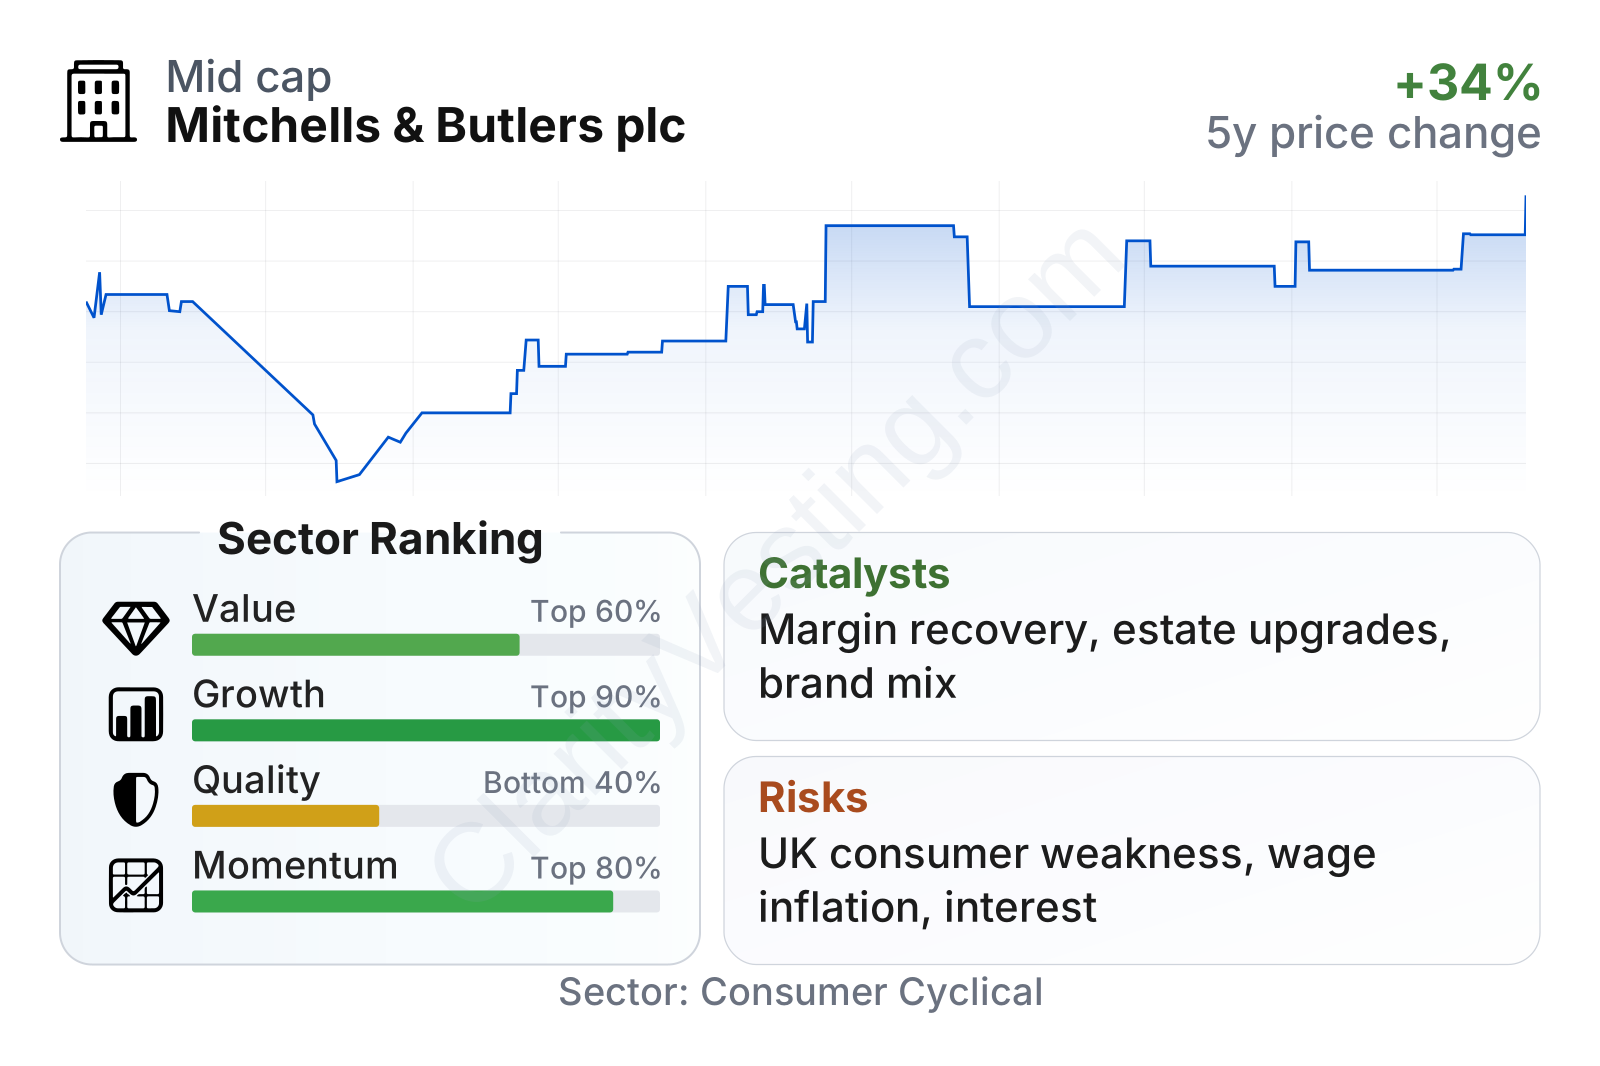
Mitchells & Butlers sits in the mid-cap range and has shown above-sector share-price momentum over the last several years, although the path has been uneven. The stock remains above its long-term average trend, reflecting improved operating performance since the post-pandemic low point.
On valuation, the business appears inexpensive relative to much of the restaurant and broader consumer cyclical group. Its earnings multiple is around 9x versus a sector median near 17x, price-to-book is also below the sector norm, and free cash flow yield is unusually strong at roughly 18% compared with about 9% for the median peer. That combination points to a market view that still assigns caution to the company despite the recovery in profits and cash generation.
Growth metrics are mixed in the short term but much stronger over a longer horizon. Recent year-over-year revenue growth has been modest at around 3%, below the sector median, yet five-year revenue per share growth is far ahead of the peer group. Margin improvement has also been better than sector norms over the same period, showing that recovery has not been based on sales alone.
Quality is more complicated. Current profitability is respectable, with operating margin around 12% and profit margin near 7%, both ahead of sector medians. Leverage looks manageable on a current net debt to EBITDA basis. However, interest coverage remains weaker than many peers, and the longer-term record still reflects the disruptions of recent years. In other words, the company looks healthier today than its multi-year averages suggest, but the balance sheet still deserves attention.
Growth
Mitchells & Butlers operates in a mature sector rather than a fast-expanding one. U.K. pubs and casual dining are not high-growth markets in the traditional sense, so the long-term case depends more on market share gains, stronger site economics, pricing discipline, brand relevance, and cash generation than on rapid industry expansion. That does not make the sector unattractive, but it does change what growth means: steady same-store sales progress and better margins matter more than unit explosions.
The company’s strategy is broadly sensible for that environment. Its brand portfolio covers several customer occasions and price points, which helps it capture demand across family dining, premium meals, bar-led socializing, and neighborhood pubs. A managed-house model also gives tighter operational control over menu pricing, promotions, labor standards, and customer experience. That can support stronger brand consistency than a more heavily franchised approach, though it also leaves the company directly exposed to staffing and cost inflation.
A key long-term catalyst is continued margin recovery. The business has already shown that modest revenue growth can translate into much stronger profit growth when purchasing, labor efficiency, menu mix, and pricing work together. Another catalyst is estate optimization: when a large operator improves site formats, refurbishes high-return venues, or reallocates capital toward stronger brands, even a low-growth market can still produce attractive earnings progression.
The company also benefits from scale. In U.K. hospitality, purchasing power, national marketing, data on customer behavior, and the ability to spread central costs across a large estate can matter a great deal. Mitchells & Butlers is one of the bigger players in the market, which gives it tools that many independent pubs and smaller chains do not have.
Recent trading updates and annual reporting have pointed to resilient like-for-like sales and continued focus on cost efficiency, premiumization, and disciplined capital allocation. None of these are transformative on their own, but together they support a credible case for gradual earnings growth if consumer conditions remain stable.
Risks
This article is for informational purposes only and does not constitute financial advice. Some content is AI-generated. See Disclaimer


