Stock Analysis · Merchants Bancorp (MBIN)
Overview
Merchants Bancorp is a regional bank holding company based in Indiana. Through Merchants Bank of Indiana, it combines traditional banking with several specialized lending businesses. In simple terms, the company gathers deposits, makes loans, earns interest on those loans, and also generates fees from mortgage-related activities and servicing.
Its business is more specialized than a typical community bank. Alongside conventional banking, Merchants has built meaningful positions in multi-family housing finance, mortgage warehouse lending, and correspondent residential mortgage banking. That mix gives it exposure to both recurring banking income and more cyclical housing-related revenue.
The largest revenue sources are not always disclosed in a clean percentage split by business line in a way that stays stable from quarter to quarter, but the company’s filings show a structure that can be summarized approximately as follows:
- Net interest income: roughly 60% to 75% of total revenue in recent years. This is the spread between what Merchants earns on loans and securities and what it pays on deposits and borrowings.
- Mortgage banking and related fee income: roughly 15% to 30%. This includes gains on sale, loan servicing, and residential mortgage banking activities.
- Other noninterest income: roughly 5% to 15%. This can include service charges, warehouse and servicing-related fees, and other banking income.
Within lending, the company has emphasized areas such as multi-family housing, mortgage warehouse financing, and other commercial lending niches. That focus has helped it scale faster than many regional banks, although it also means results can move more sharply when credit conditions or housing markets change.
The revenue path over the last few years shows strong expansion through 2024, followed by a weaker 2025. Profitability remained substantial, but rising funding costs and heavier expenses reduced the share of revenue that reached net income. That pattern matters because it suggests the franchise can grow rapidly, but earnings are more sensitive than those of a plain-vanilla deposit bank.
Key Figures
| Metric | Value | Sector ⓘ |
|---|---|---|
| Date | Oct 17, 2026 | |
| Context | ||
| Sector | Financial Services | |
| Industry | Banks - Regional | |
| Market Cap ⓘ | $2.26B | |
| Beta ⓘ | 1.21 | |
Value (Cheapness) | ||
| P/E Ratio ⓘ | 9.97 | 12.26 |
| P/B Ratio ⓘ | 0.94 | 1.23 |
| FCF Yield ⓘ | -25.16% | 10.40% |
| Dividend Yield ⓘ | 0.87% | 3.02% |
| EBIT / EV ⓘ | N/A | 8.14% |
| PEG ⓘ | N/A | |
Growth (Business expansion) | ||
| Revenue Growth ⓘ | 37.10% | 9.35% |
| RPS Growth (5Y CAGR) ⓘ | 29.23% | 12.19% |
| EPS Growth (5Y CAGR) ⓘ | -12.33% | -9.53% |
| BVPS Growth (5Y CAGR) ⓘ | 28.32% | 4.99% |
| Margin Growth (5Y Trend) ⓘ | -46.74% | -3.86% |
| FCF Growth (5Y CAGR) ⓘ | N/A | 4.81% |
| DPS Growth (5Y CAGR) ⓘ | 15.73% | 8.79% |
Quality (Business durability) | ||
| ROIC (Latest) ⓘ | N/A | 9.49% |
| ROE (Latest) ⓘ | 11.63% | 13.90% |
| ROA (Latest) ⓘ | 1.32% | 1.55% |
| ROIC (5Y Median) ⓘ | 11.82% | 7.86% |
| ROE (5Y Median) ⓘ | 16.25% | 12.17% |
| ROA (5Y Median) ⓘ | 1.84% | 1.30% |
| Net Debt / EBIT (Latest) ⓘ | N/A | 0.96 |
| Net Debt / EBIT (5Y Median) ⓘ | 2.45 | 0.73 |
| Net Debt / EBITDA (Latest) ⓘ | 13.09 | 0.92 |
| Operating Margin (Latest) ⓘ | N/A | 22.30% |
| Operating Margin (5Y Median) ⓘ | 29.26% | 24.63% |
| Debt to Equity (Latest) ⓘ | 178.90% | 58.56% |
| Profit Margin (Latest) ⓘ | 42.47% | 26.57% |
| Free Cash Flow (Latest) ⓘ | -$569.28M | |
Momentum (Price trend) | ||
| 3Y Return ⓘ | +85.13% | +88.33% |
| 12M Return (excl. last month) ⓘ | +65.62% | +19.38% |
| 6M Return ⓘ | +4.91% | +4.75% |
| Price vs. 200-Day MA ⓘ | +4.97% | +3.50% |
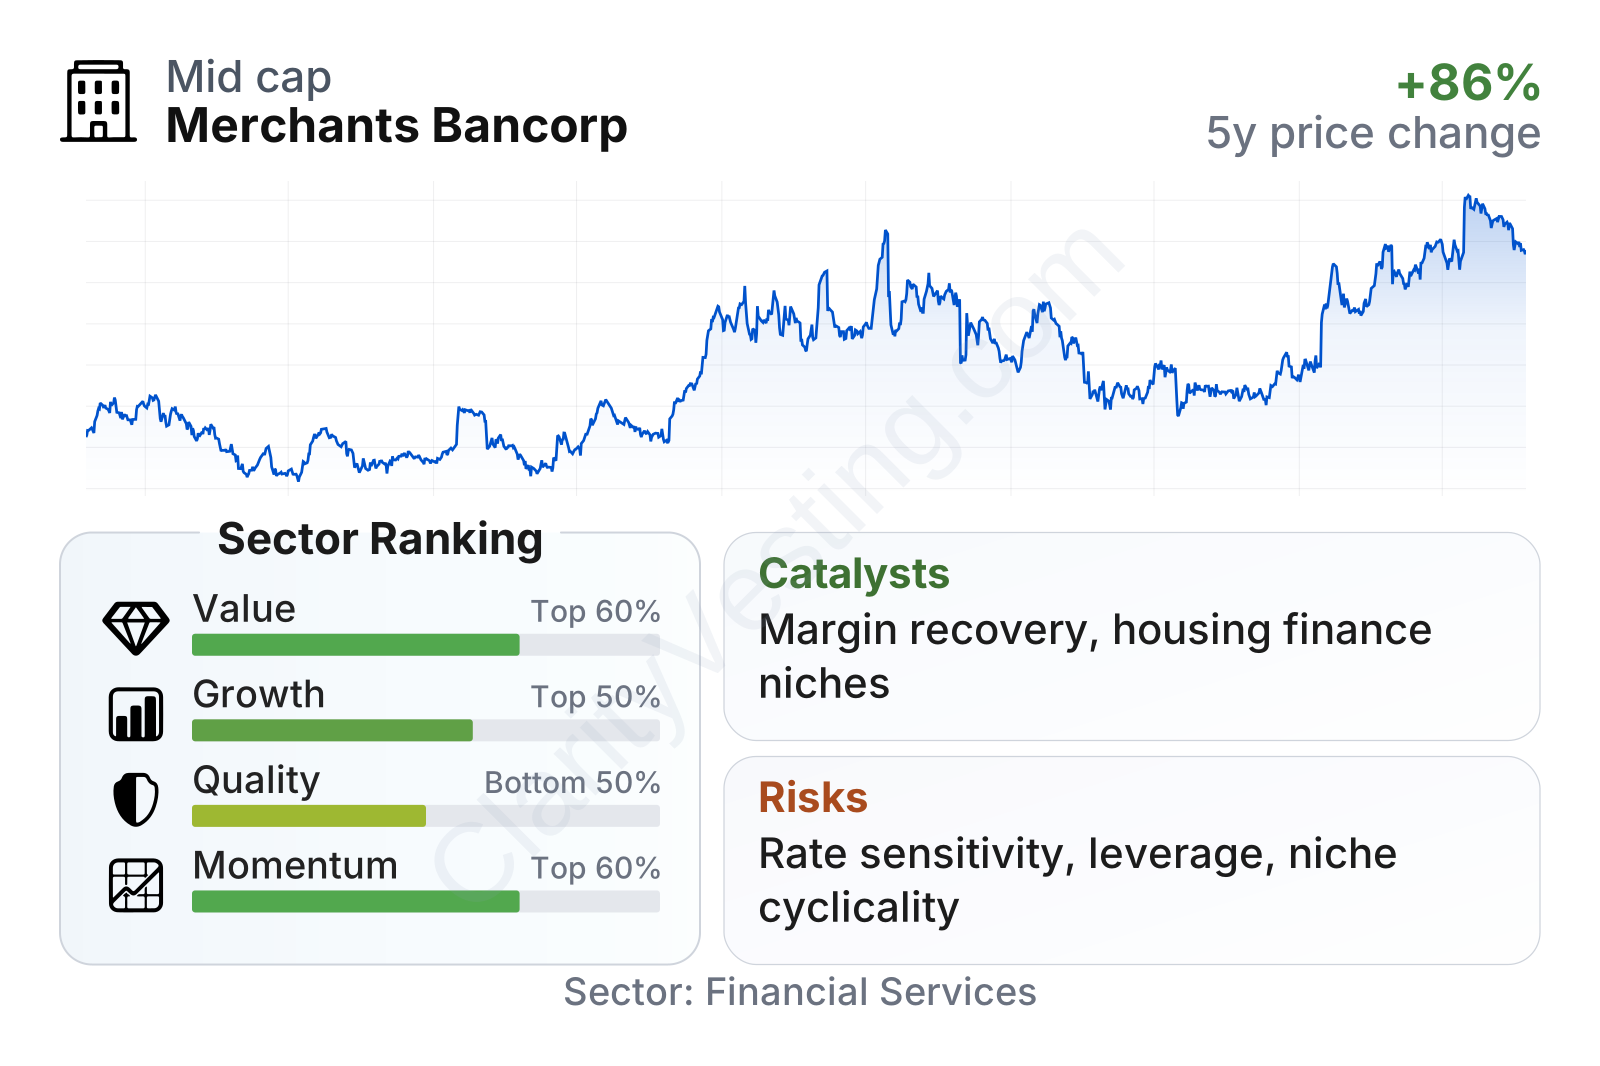
Merchants Bancorp is a mid-sized regional banking company with a market value around the lower end of the publicly traded bank universe, but still large enough to operate several specialized national lending platforms. Recent share-price performance has been strong versus much of the sector over the last year, even though the stock has been volatile over the full cycle.
The overall metrics paint a mixed but interesting profile. On valuation, the stock trades below the sector median on both earnings and book value multiples, which indicates the market is not assigning a premium despite solid recent growth. On growth, revenue expansion and book value growth stand out as clearly stronger than many peers. On quality, current returns are still respectable for a bank, but they have cooled from earlier highs and now sit closer to or slightly below sector medians on some measures. That combination usually points to a company the market sees as capable, but less predictable than a more traditional regional bank.
Growth
Merchants operates in parts of banking that still have room for expansion, especially specialized commercial real estate finance, multi-family housing, and mortgage warehouse lending. These are not guaranteed growth markets every year, but they are large and fragmented, which leaves space for focused lenders to win share if they keep credit quality under control.
The company’s strategy broadly makes sense for future growth. It has not tried to compete head-on with the largest national banks in every category. Instead, it has concentrated on narrower lines where expertise, relationships, and speed matter. That kind of positioning can support above-average growth when management executes well, because customers in these niches often value specialized underwriting and reliable funding more than sheer size.
Earnings progression has been uneven rather than smooth. Earnings per share improved strongly from 2022 through 2024, then dropped in 2025. That decline does not erase the company’s earlier operating progress, but it does show how sensitive results can be to margin pressure, loan mix, and mortgage-related activity. For a long-term view, the key question is whether 2025 was a temporary reset after very strong years or the sign of lower normalized profitability.
Book value per share is one of the more encouraging indicators here. It rose sharply over the last several years before flattening more recently. For banks, book value growth often reflects retained earnings, balance sheet expansion, and capital accumulation. Merchants’ multi-year increase has been far stronger than the sector median, which supports the view that the franchise has created value over time even if annual earnings fluctuate.
A practical catalyst is the possibility of improved banking margins if deposit costs stabilize while the company keeps growing higher-yielding loans. Another is any recovery in mortgage-related activity if housing finance conditions become more favorable. The company has also continued to highlight specialized lending platforms in its public communications, which suggests management still sees room to expand in those businesses rather than simply defend existing volume.
Recent company updates have also pointed to continued activity in balance sheet growth and capital deployment, including ongoing dividends and operating scale in core segments. None of that guarantees a step-change in profits, but it supports the case that Merchants still has multiple ways to grow beyond a standard branch-bank model.
Risks
This article is for informational purposes only and does not constitute financial advice. Some content is AI-generated. See Disclaimer


