Stock Analysis · Veradermics Incorporated (MANE)
Overview
Veradermics Incorporated is a clinical-stage biotechnology company focused on dermatology. Its work centers on developing prescription treatments for skin conditions rather than selling established commercial products today. That distinction matters for long-term analysis: the business currently depends more on research progress, clinical trial results, and regulatory milestones than on recurring product sales.
The company’s lead focus has been androgenetic alopecia, the most common form of hair loss, with an emphasis on a topical medicine designed to target pathways involved in hair growth while aiming to avoid some of the drawbacks associated with existing options. As a development-stage biotech, Veradermics is best understood as a pipeline company: its value rests on whether its drug candidates can move successfully through trials and eventually reach the market.
At this stage, revenue concentration is unusually simple because there is effectively no recurring operating revenue from product sales. Based on the latest available annual financials, the business structure looks like this:
- Product revenue: 0% — no approved commercial products generating ongoing sales.
- Collaboration or licensing revenue: 0% — no disclosed material recurring partner revenue in the latest annual period.
- Other operating revenue: 0% — the company remains in a pre-revenue phase.
That means the economic engine today is not a marketed drug portfolio but a cash balance funding research and development. The expense profile also shows where management is placing its resources: research and development represented the large majority of operating spending in the latest annual period, while administrative costs were much smaller. For a biotech at this stage, that is typical and generally signals that capital is being directed primarily toward clinical advancement.
The operating profile remains pre-revenue, but one notable trend is the rapid increase in research spending over the past three annual periods. Research and development expanded from roughly $15 million in 2023 to more than $62 million in 2025, showing a sharp acceleration in clinical investment. That can be constructive if it reflects meaningful pipeline progress, but it also raises the importance of future trial execution and financing discipline.
Key Figures
| Metric | Value | Sector ⓘ |
|---|---|---|
| Date | Oct 03, 2026 | |
| Context | ||
| Sector | Healthcare | |
| Industry | Biotechnology | |
| Market Cap ⓘ | $5.07B | |
| Beta ⓘ | N/A | |
Value (Cheapness) | ||
| P/E Ratio ⓘ | N/A | 24.06 |
| P/B Ratio ⓘ | 5.83 | 3.08 |
| FCF Yield ⓘ | -1.55% | 3.07% |
| Dividend Yield ⓘ | N/A | 2.05% |
| EBIT / EV ⓘ | -2.44% | 0.63% |
| PEG ⓘ | N/A | |
Growth (Business expansion) | ||
| Revenue Growth ⓘ | N/A | 7.50% |
| RPS Growth (5Y CAGR) ⓘ | N/A | 8.70% |
| EPS Growth (5Y CAGR) ⓘ | N/A | -18.20% |
| BVPS Growth (5Y CAGR) ⓘ | N/A | 3.95% |
| Margin Growth (5Y Trend) ⓘ | N/A | -0.58% |
| FCF Growth (5Y CAGR) ⓘ | N/A | 0.88% |
| DPS Growth (5Y CAGR) ⓘ | N/A | 6.80% |
Quality (Business durability) | ||
| ROIC (Latest) ⓘ | -31.69% | 3.29% |
| ROA (Latest) ⓘ | -21.95% | 3.02% |
| ROIC (5Y Median) ⓘ | N/A | 4.75% |
| ROA (5Y Median) ⓘ | N/A | 1.93% |
| Net Debt / EBIT (Latest) ⓘ | N/A | 1.33 |
| Net Debt / EBIT (5Y Median) ⓘ | N/A | 1.83 |
| Net Debt / EBITDA (Latest) ⓘ | N/A | 0.99 |
| Net Debt / Assets ⓘ | -38.62% | 5.33% |
| EBITDA / Interest ⓘ | N/A | 9.63 |
| Operating Margin (Latest) ⓘ | N/A | 9.25% |
| Operating Margin (5Y Median) ⓘ | N/A | 7.80% |
| Debt to Equity (Latest) ⓘ | 0.05% | 28.99% |
| Profit Margin (Latest) ⓘ | N/A | 3.60% |
| Free Cash Flow (Latest) ⓘ | -$78.33M | |
Momentum (Price trend) | ||
| 3Y Return ⓘ | N/A | +37.48% |
| 12M Return (excl. last month) ⓘ | N/A | +20.85% |
| 6M Return ⓘ | +99.42% | +9.73% |
| Price vs. 200-Day MA ⓘ | N/A | +4.69% |
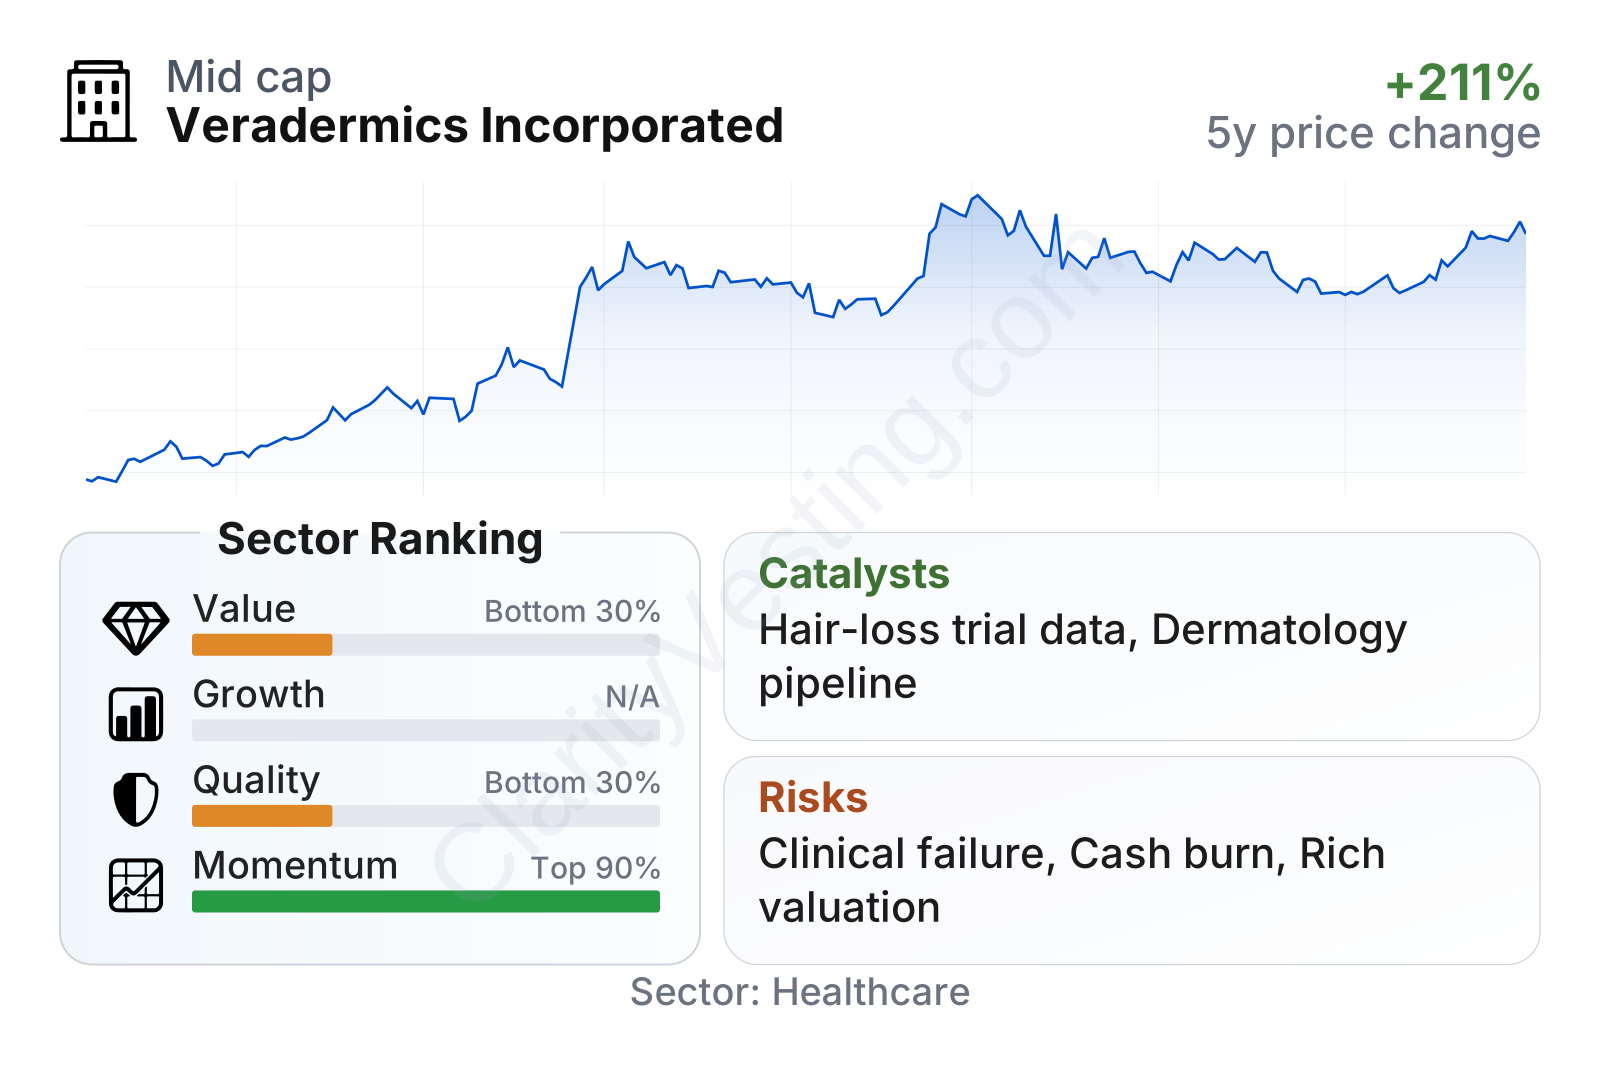
The share price has been extremely strong in recent months, with a gain of roughly 94% over six months, placing momentum well above most healthcare peers. That kind of move usually reflects rising expectations around the pipeline rather than a change in current earnings power.
The table also highlights a split picture. Balance-sheet risk appears limited because debt is almost nonexistent and net cash is substantial, as shown by negative net debt relative to assets. However, profitability and capital efficiency remain weak, which is normal for a pre-revenue biotech but still important: returns on capital and assets are deeply negative, free cash flow remains negative, and valuation metrics based on book value look richer than the sector median. In short, the market is placing a meaningful value on future drug potential despite the absence of current revenue.
Growth
Dermatology is an attractive area within healthcare because many conditions are chronic, visible, and emotionally significant for patients, which can support durable demand if a treatment works well. Hair loss in particular is a large market with room for better therapies, especially treatments that can combine visible efficacy, ease of use, and an acceptable safety profile. That gives Veradermics exposure to a real medical and commercial need rather than a niche research concept.
The company’s strategy is coherent for this market. Instead of building a broad portfolio across unrelated diseases, it is concentrating on dermatology and on a lead program in a category where current treatments leave gaps. For a small biotech, focus can be an advantage because it allows management to direct capital and scientific attention toward a narrower set of milestones.
The strongest potential catalyst is clinical progress in its lead hair-loss program. For pre-revenue biotech companies, meaningful value creation often comes from a small number of events: updated trial data, progression into later-stage studies, regulatory feedback, or partnership discussions. If Veradermics can demonstrate convincing efficacy with tolerable safety in larger studies, its commercial relevance could change substantially because hair-loss treatment is a broad market with strong patient interest.
Another supportive element is financial flexibility relative to many early-stage biotech peers. The company’s low debt burden reduces balance-sheet strain, which is important when a business is still funding losses. That does not remove financing risk, but it does mean the growth plan is not currently built on heavy leverage.
Recent market action suggests that investors have become more optimistic about the company’s near-to-medium-term prospects. While share-price strength is not proof of business success, it often signals that the market sees a clearer path toward a major milestone, most likely tied to clinical development and future commercialization potential.
Risks
This article is for informational purposes only and does not constitute financial advice. Some content is AI-generated. See Disclaimer


