Stock Analysis · Microalliance Group Inc (MALG)
Overview
Microalliance Group Inc is presented in market classifications as a Consumer Defensive company in the Packaged Foods industry, but the public information available to outside readers appears limited and unusually thin for a company of this reported size. That makes a basic point important from the start: long-term analysis here depends not only on the business itself, but also on how clearly the company explains what it does, how it earns money, and how sustainable those earnings really are.
Based on the financial profile visible in public records and market databases, the company appears to generate revenue from packaged food-related operations. However, a reliable revenue breakdown by product, geography, customer type, or business segment is not clearly available in the public materials reviewed. Because of that, it is not possible to present a trustworthy percentage split of revenue sources without risking overstatement.
- Main reported activity: packaged foods and related consumer staples operations.
- Revenue concentration: no dependable public segment split was clearly disclosed in the reviewed materials.
- Business mix transparency: limited, which is a meaningful issue for anyone trying to understand the company over a multi-year period.
The latest available income flow suggests a business that, at least in the reported period shown, converted a very large share of revenue into operating profit and net income. That is unusual in packaged foods, where margins are typically much lower. It may point to a highly specific operating model, one-off accounting effects, or a business structure that does not resemble a standard large-scale food manufacturer. This is one of the first areas that deserves caution when judging the company’s quality.
The income flow shown here stands out for its very high reported profitability relative to revenue and fairly modest selling and administrative costs. On the surface, that looks impressive, but it also sits far outside normal industry patterns, which means the sustainability and source of those margins matter as much as the margins themselves.
Key Figures
| Metric | Value | Sector ⓘ |
|---|---|---|
| Date | Oct 17, 2026 | |
| Context | ||
| Sector | Consumer Defensive | |
| Industry | Packaged Foods | |
| Market Cap ⓘ | $704.98M | |
| Beta ⓘ | -29.99 | |
Value (Cheapness) | ||
| P/E Ratio ⓘ | 4.63 | 17.88 |
| P/B Ratio ⓘ | 23.08 | 1.29 |
| FCF Yield ⓘ | 0.40% | 12.39% |
| Dividend Yield ⓘ | N/A | 2.85% |
| EBIT / EV ⓘ | 1.43% | 6.43% |
| PEG ⓘ | N/A | |
Growth (Business expansion) | ||
| Revenue Growth ⓘ | -74.90% | 4.10% |
| RPS Growth (5Y CAGR) ⓘ | 317.60% | 6.18% |
| EPS Growth (5Y CAGR) ⓘ | N/A | -13.59% |
| BVPS Growth (5Y CAGR) ⓘ | N/A | 3.20% |
| Margin Growth (5Y Trend) ⓘ | N/A | -0.15% |
| FCF Growth (5Y CAGR) ⓘ | 613.15% | 4.10% |
| DPS Growth (5Y CAGR) ⓘ | N/A | 6.79% |
Quality (Business durability) | ||
| ROIC (Latest) ⓘ | 37.20% | 12.34% |
| ROA (Latest) ⓘ | 31.21% | 6.30% |
| ROIC (5Y Median) ⓘ | N/A | 10.49% |
| ROA (5Y Median) ⓘ | N/A | 5.44% |
| Net Debt / EBIT (Latest) ⓘ | N/A | 1.96 |
| Net Debt / EBIT (5Y Median) ⓘ | N/A | 2.35 |
| Net Debt / EBITDA (Latest) ⓘ | N/A | 1.38 |
| Net Debt / Assets ⓘ | N/A | 21.51% |
| EBITDA / Interest ⓘ | N/A | 9.46 |
| Operating Margin (Latest) ⓘ | 66.83% | 8.87% |
| Operating Margin (5Y Median) ⓘ | -13.56% | 9.53% |
| Debt to Equity (Latest) ⓘ | N/A | 72.35% |
| Profit Margin (Latest) ⓘ | 42.90% | 5.40% |
| Free Cash Flow (Latest) ⓘ | $2.79M | |
Momentum (Price trend) | ||
| 3Y Return ⓘ | +14.55% | +20.92% |
| 12M Return (excl. last month) ⓘ | +486.67% | +2.13% |
| 6M Return ⓘ | +1.44% | +1.26% |
| Price vs. 200-Day MA ⓘ | -25.70% | +1.39% |
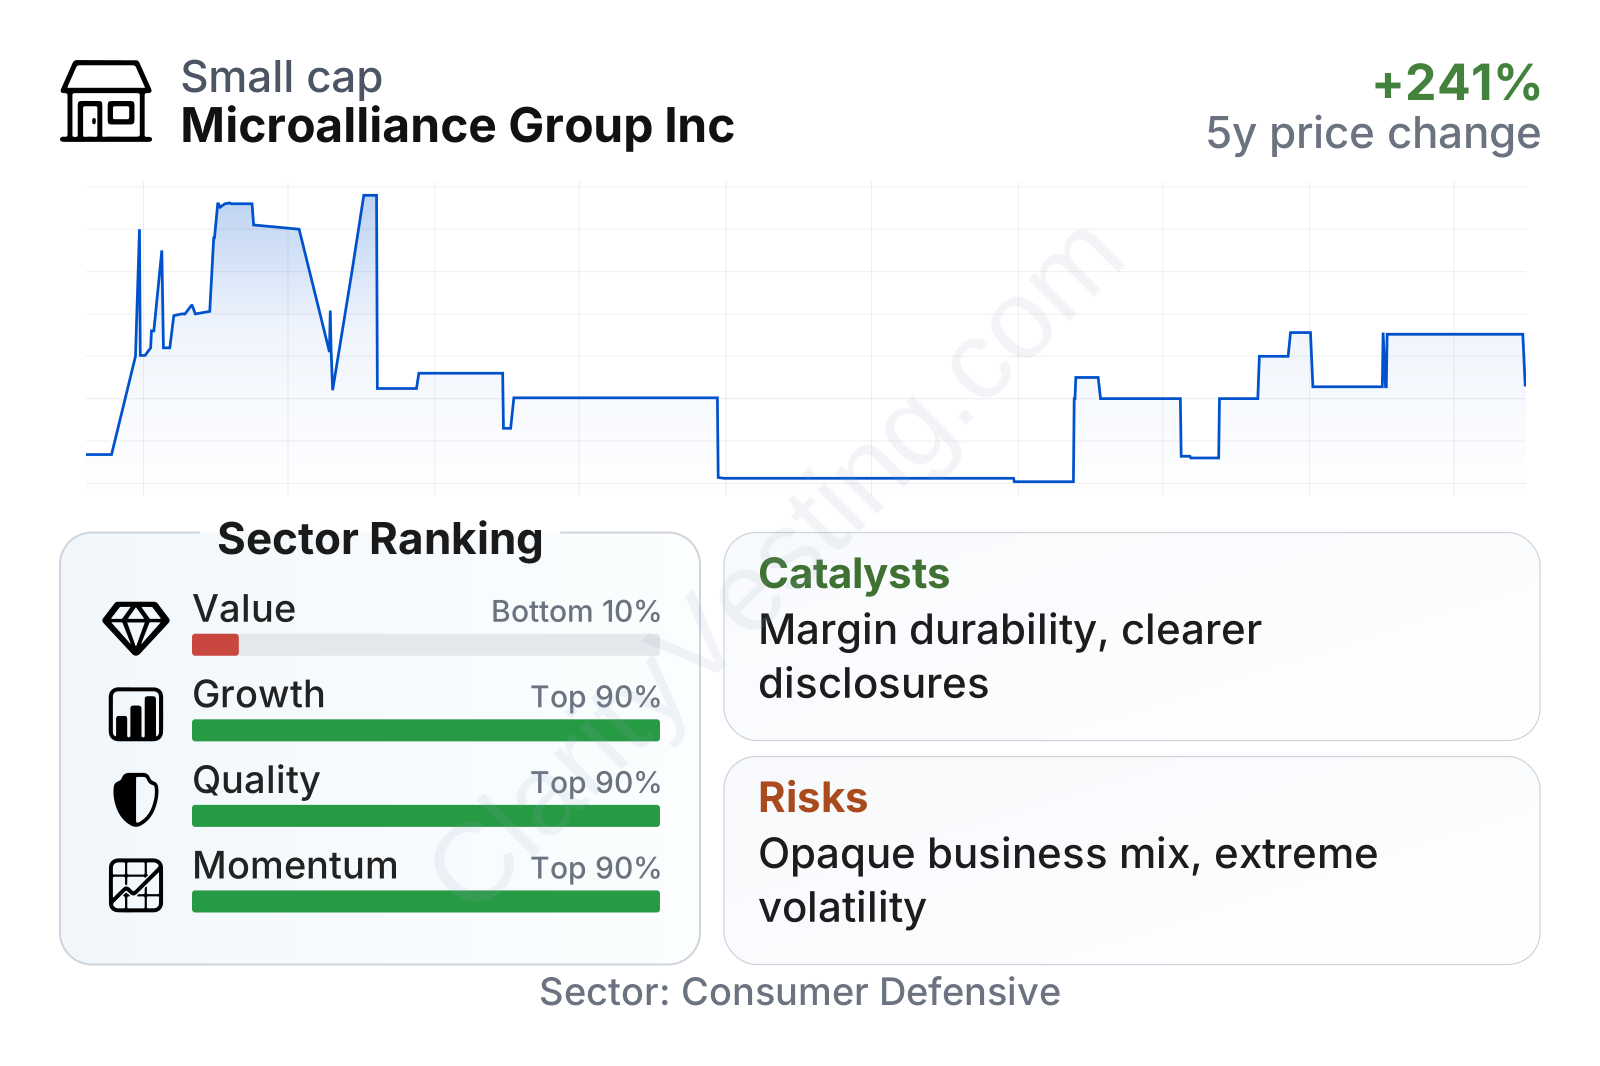
The overall picture is mixed. The company ranks very strongly on quality, growth, and momentum measures in the sector comparison, but the details are far less straightforward than the headline ranks suggest. Recent profitability metrics are exceptionally high, while recent year-over-year revenue growth is deeply negative. At the same time, multi-year growth numbers are extraordinarily strong, which often signals a company that has gone through major discontinuities rather than a smooth operating expansion. The share price history also shows extreme volatility, with collapses and rebounds that are unusual for a normal consumer staples business.
Microalliance is a small-cap company by public market standards. Its latest reported free cash flow is positive but modest relative to its market value, and the value factor ranks near the bottom of the sector despite a low trailing P/E. That apparent contradiction comes mainly from a very high price-to-book ratio and weak free-cash-flow yield, which suggest the stock does not look broadly cheap once more than one valuation yardstick is considered.
Growth
The packaged foods industry is generally considered a mature and defensive segment rather than a fast-growth one. Demand can be resilient because food purchases are recurring, but long-term expansion usually depends on brand strength, distribution gains, product innovation, acquisitions, or entry into higher-margin niches. For Microalliance, the central question is whether its results reflect a durable business platform or a narrow set of financial outcomes that may not repeat.
Some of the reported long-term growth metrics are striking. Revenue per share and free cash flow have expanded at rates far above sector norms over the past five years, and recent return on capital and return on assets are also well ahead of industry medians. If these figures reflect a genuine operating transformation, that would be a meaningful positive catalyst because it would suggest the company has found a more efficient and profitable model than many peers.
There is also a market-based catalyst visible in the price record: the stock experienced a sharp rebound after trading at very depressed levels. That kind of move often indicates that the market is re-evaluating the business, capital structure, or earnings profile. Still, price recovery alone is not the same as business strengthening. For long-term analysis, the more important catalyst would be stronger public disclosure that confirms where revenue is coming from, how margins are generated, and whether cash flow remains durable.
Without a clearer operational roadmap from management, the growth case remains highly dependent on interpretation of reported financial outcomes rather than on easily verifiable business expansion drivers such as capacity additions, major customer wins, new brand launches, or geographic scale-up.
Risks
This article is for informational purposes only and does not constitute financial advice. Some content is AI-generated. See Disclaimer


