Stock Analysis · Madison Air Solutions Corporation (MAIR)
Overview
Madison Air Solutions Corporation is a building products company focused on commercial and industrial air movement, air control, and ventilation equipment. Its products are used in places such as data centers, schools, hospitals, warehouses, factories, laboratories, and other non-residential buildings where airflow, indoor air quality, temperature control, and energy efficiency matter. The business sits within the broader HVAC and air management market, but it is more specialized than a general heating and cooling manufacturer because much of its portfolio is tied to critical airflow systems rather than standard residential equipment.
The company’s revenue base is primarily built around engineered air management products sold into commercial construction, renovation, and specialized industrial applications. Public filings describe the company as operating through a set of brands and product lines rather than through many separately reported revenue segments, so precise percentages by product family are not always disclosed in a simple breakdown. Based on company descriptions of its portfolio, the main sources of revenue can be grouped as follows:
- Air movement equipment — fans, blowers, and ventilation systems used to move air through commercial and industrial buildings.
- Air control products — dampers, louvers, and systems that regulate pressure, safety, smoke control, and airflow direction.
- Specialized ventilation and indoor air quality solutions — products for laboratories, healthcare settings, schools, and other environments with stricter air-performance requirements.
- Equipment tied to high-performance buildings and data centers — solutions designed for cooling support, airflow optimization, and energy-efficient building operation.
Recent financial trends show a business that has been scaling up: revenue rose from about $2.6 billion in 2024 to about $3.5 billion in 2025, while gross profit also expanded. Operating income improved over that period as well, which suggests the company has been able to grow without sacrificing its basic operating economics. The weak point is below the operating line, where interest expense remained very large and kept net income comparatively low.
The profit flow highlights a clear pattern: revenue and gross profit have grown meaningfully over the last three years, and operating income has moved higher, but interest costs still absorb a large share of earnings. That makes the underlying business look stronger than the final net income figure alone would suggest, while also underlining how important balance-sheet improvement is for the next phase.
Key Figures
| Metric | Value | Sector ⓘ |
|---|---|---|
| Date | Oct 03, 2026 | |
| Context | ||
| Sector | Industrials | |
| Industry | Building Products & Equipment | |
| Market Cap ⓘ | $12.49B | |
| Beta ⓘ | N/A | |
Value (Cheapness) | ||
| P/E Ratio ⓘ | 57.88 | 22.45 |
| P/B Ratio ⓘ | 3.20 | 1.98 |
| FCF Yield ⓘ | 2.28% | 6.31% |
| Dividend Yield ⓘ | N/A | 1.96% |
| EBIT / EV ⓘ | 3.94% | 4.81% |
| PEG ⓘ | N/A | |
Growth (Business expansion) | ||
| Revenue Growth ⓘ | 20.90% | 9.10% |
| RPS Growth (5Y CAGR) ⓘ | 17.32% | 7.75% |
| EPS Growth (5Y CAGR) ⓘ | N/A | -13.59% |
| BVPS Growth (5Y CAGR) ⓘ | N/A | 6.22% |
| Margin Growth (5Y Trend) ⓘ | -1.34% | 0.72% |
| FCF Growth (5Y CAGR) ⓘ | 29.54% | 10.98% |
| DPS Growth (5Y CAGR) ⓘ | N/A | 9.48% |
Quality (Business durability) | ||
| ROIC (Latest) ⓘ | N/A | 10.92% |
| ROA (Latest) ⓘ | N/A | 5.41% |
| ROIC (5Y Median) ⓘ | N/A | 9.21% |
| ROA (5Y Median) ⓘ | N/A | 4.94% |
| Net Debt / EBIT (Latest) ⓘ | 4.61 | 2.07 |
| Net Debt / EBIT (5Y Median) ⓘ | 9.57 | 2.28 |
| Net Debt / EBITDA (Latest) ⓘ | 3.51 | 1.43 |
| Net Debt / Assets ⓘ | 33.73% | 19.27% |
| EBITDA / Interest ⓘ | 2.42 | 9.53 |
| Operating Margin (Latest) ⓘ | 17.84% | 10.50% |
| Operating Margin (5Y Median) ⓘ | 15.75% | 10.27% |
| Debt to Equity (Latest) ⓘ | 84.31% | 65.48% |
| Profit Margin (Latest) ⓘ | 3.73% | 6.62% |
| Free Cash Flow (Latest) ⓘ | $284.60M | |
Momentum (Price trend) | ||
| 3Y Return ⓘ | N/A | +58.56% |
| 12M Return (excl. last month) ⓘ | N/A | +15.63% |
| 6M Return ⓘ | N/A | +4.19% |
| Price vs. 200-Day MA ⓘ | N/A | +0.93% |
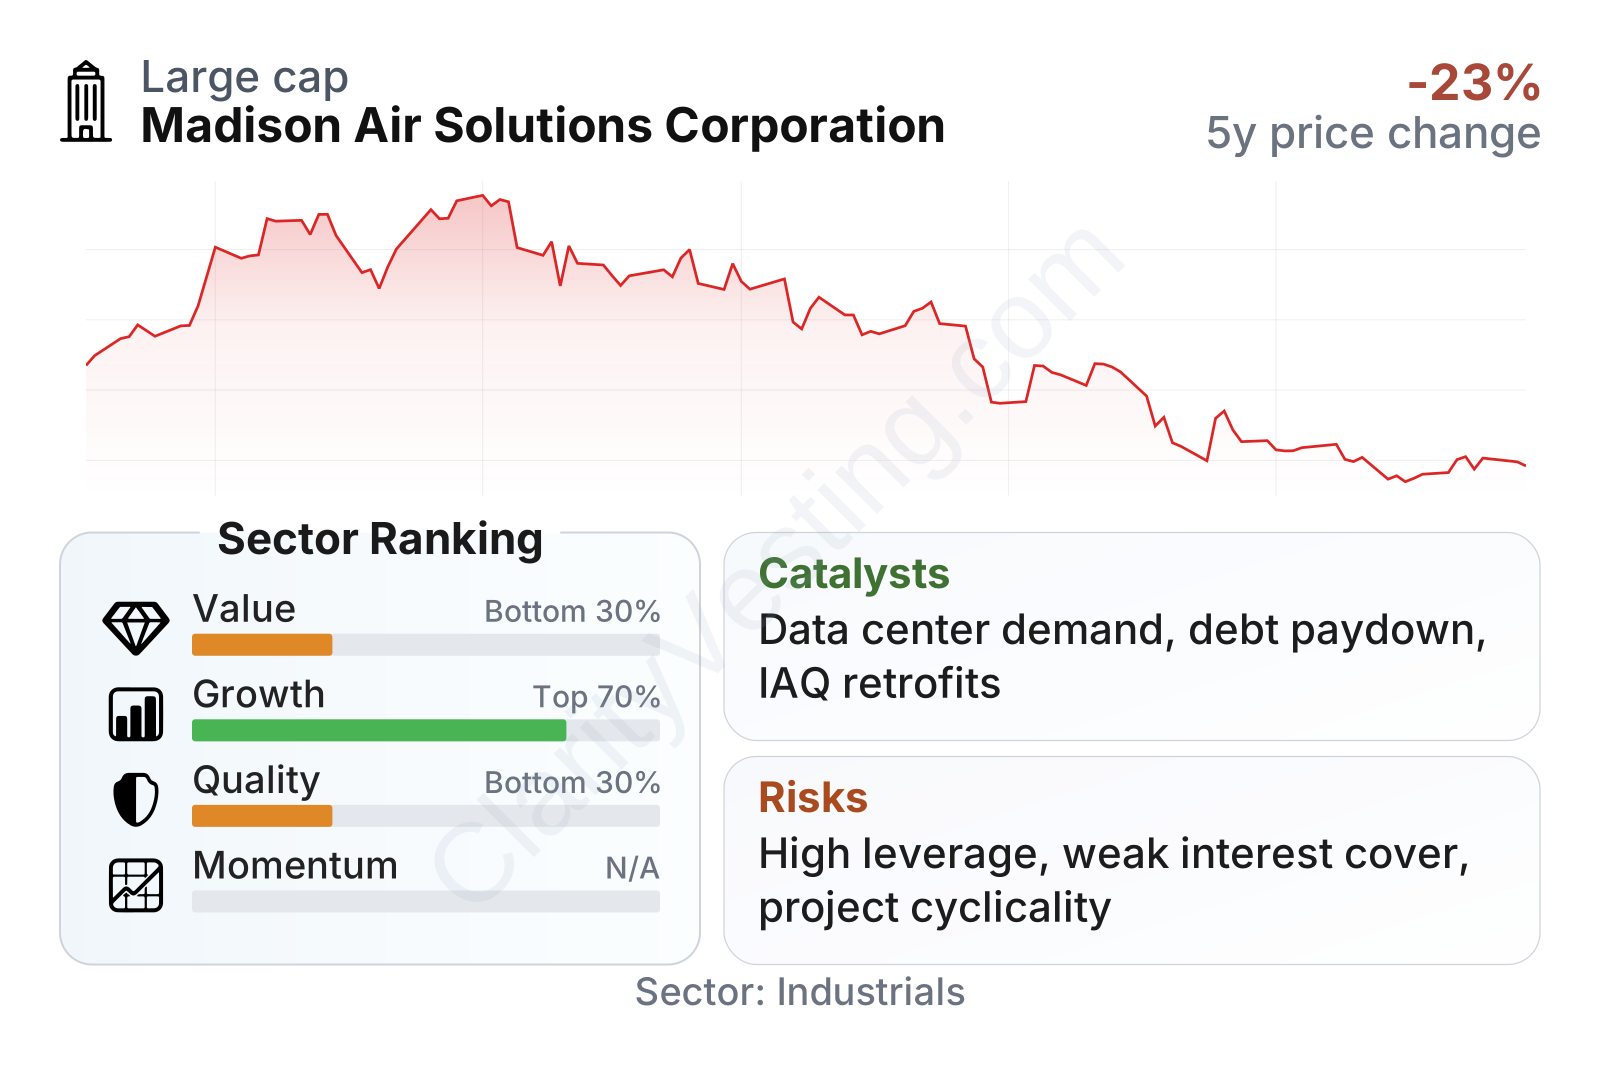
The overall financial profile is mixed. Growth has been stronger than the sector median, with revenue up about 21% year over year and five-year revenue-per-share growth in the high teens. Free cash flow has also expanded at a faster pace than many peers. Profitability at the operating level looks healthy, with operating margin around 18%, above the sector median near 10%.
At the same time, valuation is elevated. The earnings multiple is well above the sector median, the price-to-book ratio is also richer than typical peers, and free-cash-flow yield is comparatively low. Quality metrics are held back by leverage: net debt to EBITDA is above 3.5x, net debt to EBIT is above 4.5x, and interest coverage is only around 2.4x, far below the sector median. In short, the market appears to be giving the company credit for growth and margin quality, while still looking past a balance sheet that remains stretched.
Growth
Madison Air Solutions operates in an area with favorable long-term demand drivers. Commercial buildings increasingly need better energy efficiency, tighter ventilation standards, and more advanced air control systems. Indoor air quality has become a more visible priority in schools, healthcare facilities, public buildings, and workplaces. Another important tailwind is the buildout of data centers, which require high-performance airflow and cooling-related infrastructure. These trends support demand even when general construction activity is uneven.
The company’s strategy also appears logical for this environment. It is positioned in products that are often specified into projects because performance, code compliance, and reliability matter. That tends to create a better competitive position than purely commodity-like equipment. If the company keeps gaining exposure to technically demanding applications such as data centers, life sciences, healthcare, and energy-efficient retrofits, its addressable market can expand faster than standard non-residential construction alone.
One encouraging element in the recent numbers is that revenue growth has been accompanied by a larger increase in gross profit over the last few years. This can indicate a mix shift toward products with stronger pricing, better project quality, or more specialized applications. Free cash flow has also grown quickly over a five-year view, which matters because it gives the company more capacity to reduce debt, support acquisitions, or invest in manufacturing and product development.
A meaningful catalyst is the company’s exposure to infrastructure tied to electrification and digital capacity. Data center construction, stricter building codes, and retrofits for healthier and more efficient buildings could all support demand. If interest costs start to decline through refinancing or debt reduction, a larger portion of operating earnings could eventually reach net income, which would materially change how the market views the business.
Risks
This article is for informational purposes only and does not constitute financial advice. Some content is AI-generated. See Disclaimer


