Stock Analysis · Main Street Capital Corporation (MAIN)
Overview
Main Street Capital Corporation is a specialty finance company structured as a business development company, or BDC. In simple terms, it provides capital to privately owned businesses, mainly in the lower middle market, and earns money from interest on loans, fees, and gains or dividend income from equity investments. It also manages third-party investment vehicles, which adds a smaller but useful fee-based revenue stream alongside its investing activity.
The company’s model is built around supplying flexible financing to companies that are often too large for small community lenders but not large enough to access public debt markets easily. Main Street typically combines debt investments, which generate recurring income, with equity stakes, which can add upside if portfolio companies grow or are sold at attractive values. This mix has long been a defining feature of the business.
Based on recent annual reporting, Main Street’s revenue is primarily tied to investment income, with a smaller contribution from external asset management and occasional realized or unrealized gains. The broad revenue mix can be described as follows:
- Interest and fee income from debt investments: approximately 70% to 80% of total investment-related income. This is the core engine of the business and comes from loans made to portfolio companies.
- Dividend income and equity-related returns: approximately 10% to 20%. This includes cash dividends and value creation from ownership interests in portfolio companies.
- Externally managed investment advisory and administrative fees: approximately 5% to 10%. This comes from managing capital for other vehicles and clients.
- Realized and unrealized gains: variable from year to year. These can materially affect reported earnings, but they are less predictable than recurring interest income.
Main Street stands out within the BDC industry because it has historically emphasized internally managed operations. That matters because it can keep more of the economics inside the company rather than paying an outside manager, which can support returns over long periods if underwriting remains disciplined.
The overall financial picture shows a business that expanded revenue strongly from 2022 through 2024, with net income also moving higher over that period. In 2025, revenue stayed high but profitability eased somewhat, suggesting that the portfolio remained productive while expenses and valuation movements became less favorable than in the prior peak year.
Key Figures
| Metric | Value | Sector ⓘ |
|---|---|---|
| Date | Oct 10, 2026 | |
| Context | ||
| Sector | Financial Services | |
| Industry | Asset Management | |
| Market Cap ⓘ | $5.09B | |
| Beta ⓘ | 0.75 | |
Value (Cheapness) | ||
| P/E Ratio ⓘ | 10.94 | 12.38 |
| P/B Ratio ⓘ | 1.58 | 1.23 |
| FCF Yield ⓘ | 7.00% | 10.23% |
| Dividend Yield ⓘ | 5.73% | 3.01% |
| EBIT / EV ⓘ | 5.98% | 8.08% |
| PEG ⓘ | 1.76 | |
Growth (Business expansion) | ||
| Revenue Growth ⓘ | 3.90% | 9.50% |
| RPS Growth (5Y CAGR) ⓘ | 4.87% | 12.21% |
| EPS Growth (5Y CAGR) ⓘ | -13.63% | -9.62% |
| BVPS Growth (5Y CAGR) ⓘ | 6.60% | 4.98% |
| Margin Growth (5Y Trend) ⓘ | -7.72% | -4.07% |
| FCF Growth (5Y CAGR) ⓘ | N/A | 4.76% |
| DPS Growth (5Y CAGR) ⓘ | 13.01% | 8.79% |
Quality (Business durability) | ||
| ROIC (Latest) ⓘ | 7.71% | 9.35% |
| ROE (Latest) ⓘ | 14.80% | 13.91% |
| ROA (Latest) ⓘ | 8.04% | 1.53% |
| ROIC (5Y Median) ⓘ | 10.22% | 7.86% |
| ROE (5Y Median) ⓘ | 18.69% | 12.22% |
| ROA (5Y Median) ⓘ | 9.87% | 1.29% |
| Net Debt / EBIT (Latest) ⓘ | 5.46 | 0.99 |
| Net Debt / EBIT (5Y Median) ⓘ | 4.64 | 0.73 |
| Net Debt / EBITDA (Latest) ⓘ | 5.39 | 0.93 |
| Operating Margin (Latest) ⓘ | 64.74% | 22.19% |
| Operating Margin (5Y Median) ⓘ | 80.71% | 24.30% |
| Debt to Equity (Latest) ⓘ | 80.02% | 60.24% |
| Profit Margin (Latest) ⓘ | 78.49% | 26.49% |
| Free Cash Flow (Latest) ⓘ | $356.33M | |
Momentum (Price trend) | ||
| 3Y Return ⓘ | +72.21% | +88.52% |
| 12M Return (excl. last month) ⓘ | -7.35% | +19.65% |
| 6M Return ⓘ | +4.28% | +6.00% |
| Price vs. 200-Day MA ⓘ | +0.70% | +3.61% |
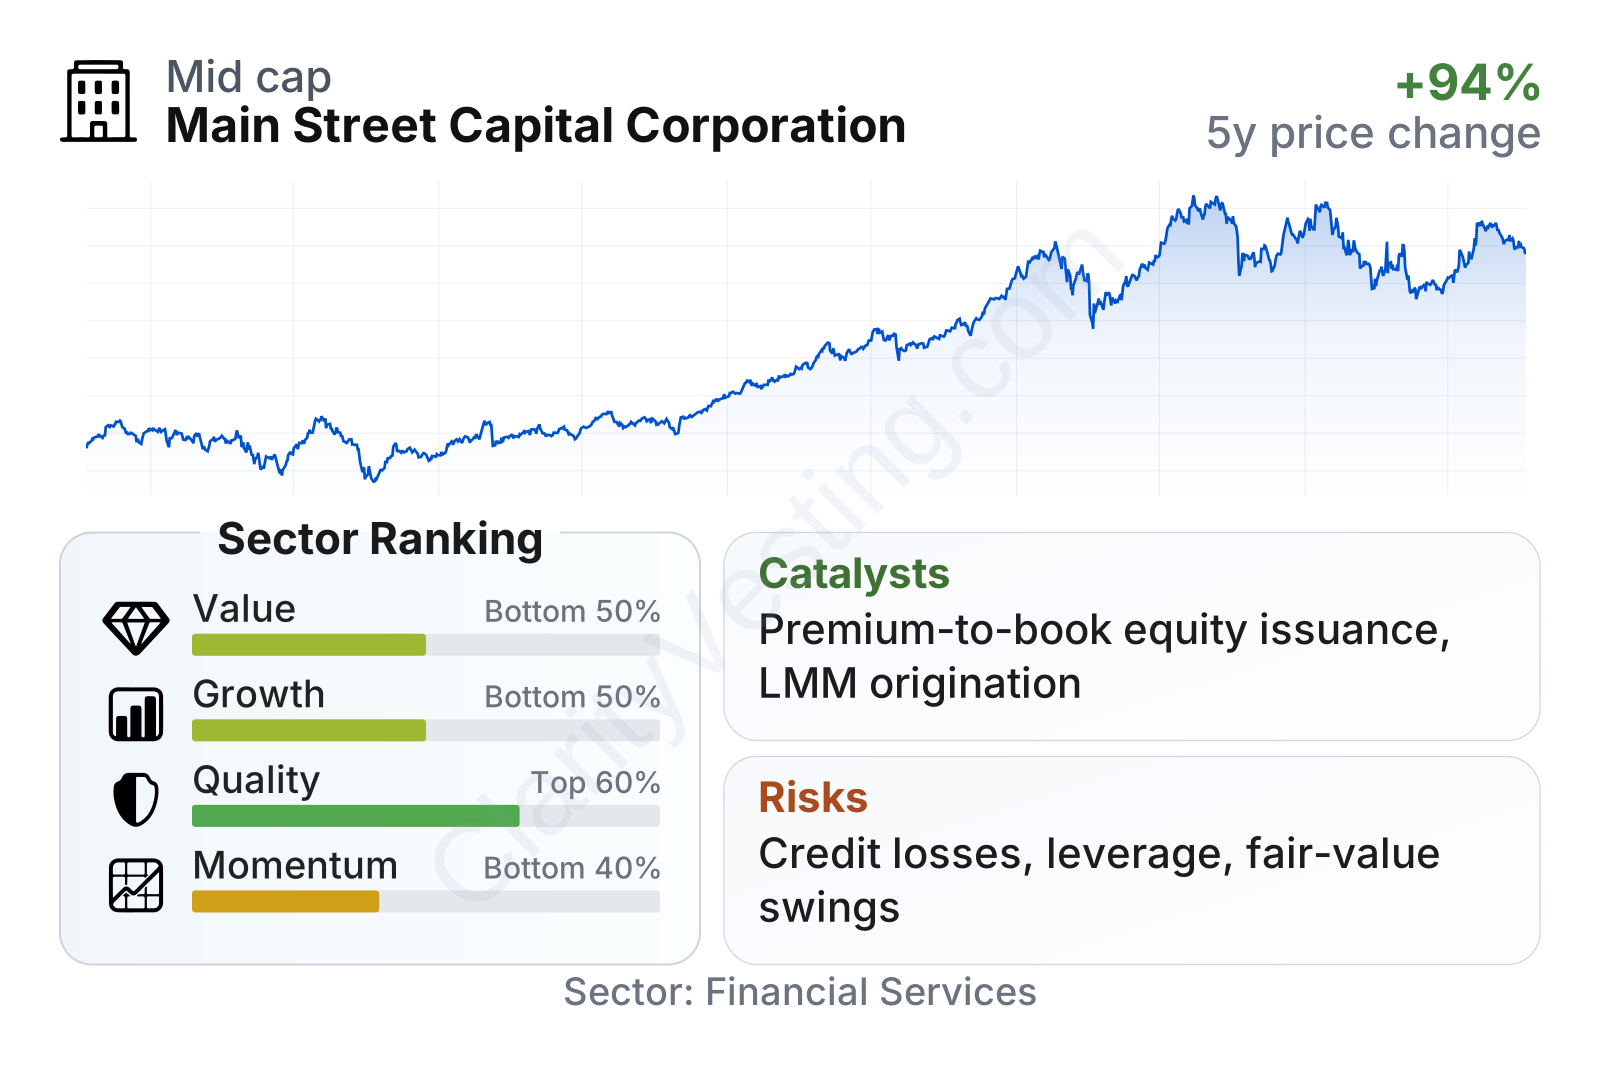
Main Street is a mid-sized public BDC with a market value a little above $5 billion and a beta below 1, meaning the stock has tended to move less violently than the broader market. The current profile is mixed: quality metrics are better than much of the financial sector, while growth, momentum, and traditional value screens look less favorable. The dividend yield is notably above the sector median, but the price-to-book ratio is also above the sector median, which shows that the market is assigning a premium to the franchise despite more moderate recent growth.
The share price history also reflects that premium. After a sharp dip in 2022, the stock recovered strongly through 2024 and reached much higher levels in 2025 before pulling back in 2026. That pattern suggests the market has been willing to reward Main Street’s income generation and consistency, but not without periods of re-rating when conditions for private credit become more uncertain.
Growth
Main Street operates in private credit, a part of finance that has expanded meaningfully as banks have become more constrained by regulation and risk limits. That broad industry backdrop remains supportive. Many smaller private companies still need tailored financing, and BDCs like Main Street can fill that gap with senior loans, subordinated debt, and equity capital. This gives the company exposure to a sector that still has room to grow, especially if traditional lenders remain selective.
The company’s strategy also makes sense for long-term expansion. Its focus on lower middle market companies can be attractive because this segment often has less competition than larger sponsored deals. Main Street also benefits from combining lending with selective equity ownership, which can raise returns over time when portfolio companies perform well. On top of that, its external asset management platform creates an additional stream of fee income that does not require the same balance sheet usage as direct investing.
Earnings per share improved sharply from 2021 through 2023, then stabilized around the low-$4 range in 2024 and 2025. That plateau suggests Main Street has moved from a rebound phase into a more mature earnings period, where future progress may depend less on easy post-rate-hike benefits and more on portfolio growth, credit performance, and successful exits.
Book value per share has continued to trend upward over the past several years, rising from about $26 in 2021 to above $33 by 2025. For a BDC, that is an important sign because book value reflects the underlying worth of the investment portfolio after liabilities. Steady growth here suggests that, despite normal fluctuations in quarterly marks, the portfolio has compounded value over time.
A meaningful catalyst is Main Street’s ability to keep raising capital efficiently when its shares trade above book value. BDCs that maintain a market premium can issue equity with less dilution pressure than peers trading below net asset value. Combined with retained spillover income, this can help fund additional investments and support dividend capacity. Company updates in 2026 have also continued to emphasize active origination and portfolio management, which indicates that deployment opportunities remain available rather than drying up.
Risks
This article is for informational purposes only and does not constitute financial advice. Some content is AI-generated. See Disclaimer