Stock Analysis · Mid-America Apartment Communities Inc (MAA)
Overview
Mid-America Apartment Communities, Inc. is a residential real estate investment trust, or REIT. In simple terms, it owns apartment communities, rents units to residents, and distributes a large share of its taxable income through dividends, which is the standard REIT model. The company focuses mainly on large and growing markets in the Sunbelt region of the United States, with a footprint across states such as Texas, Florida, Georgia, North Carolina, Tennessee, and Arizona. Its properties are generally positioned in the middle-to-upper range of the apartment market rather than luxury-only or deeply affordable housing.
Its business is fairly easy to understand: acquire or develop apartment communities, keep occupancy high, raise rents carefully, control operating costs, and recycle capital when certain properties no longer fit the portfolio. This gives MAA a recurring revenue base that is usually more stable than many cyclical real estate categories such as offices or hotels.
The main sources of revenue are concentrated in apartment operations. Based on company reporting structure and typical REIT disclosures, the mix is approximately as follows:
- Rental and other property revenues: about 97% to 99% — monthly apartment rent, lease-related charges, parking, pet fees, utility reimbursements, and other resident services across the owned portfolio.
- Fee and other non-property income: about 1% to 3% — items such as property management or ancillary income, plus occasional smaller operating items outside core rent collections.
- Property sales gains: variable and not a stable operating revenue source — these can meaningfully affect earnings in some periods, but they are not part of the recurring rent engine and should be treated separately from normal operations.
That concentration is important. MAA is not a diversified conglomerate with many unrelated businesses; it is primarily a pure-play apartment landlord. For long-term analysis, the central questions are therefore straightforward: are Sunbelt apartment markets likely to stay attractive, can the company maintain occupancy and pricing power, and can it do so without taking on excessive leverage?
The business has grown revenue over the past several years, but profit conversion has become a bit tighter. Revenue moved up from roughly $1.8 billion in 2021 to a little above $2.2 billion in 2025, while net income peaked earlier and has since eased. That pattern suggests the portfolio is still expanding, but higher costs and financing expense are taking a larger share of each revenue dollar than they did during the strongest post-pandemic years.
Key Figures
| Metric | Value | Sector ⓘ |
|---|---|---|
| Date | Oct 17, 2026 | |
| Context | ||
| Sector | Real Estate | |
| Industry | REIT - Residential | |
| Market Cap ⓘ | $13.75B | |
| Beta ⓘ | 0.73 | |
Value (Cheapness) | ||
| P/E Ratio ⓘ | 34.01 | 17.38 |
| P/B Ratio ⓘ | 2.55 | 0.85 |
| FCF Yield ⓘ | 4.14% | 7.38% |
| Dividend Yield ⓘ | 5.23% | 4.85% |
| EBIT / EV ⓘ | 3.20% | 3.78% |
| PEG ⓘ | 7.03 | |
Growth (Business expansion) | ||
| Revenue Growth ⓘ | 1.00% | 5.30% |
| RPS Growth (5Y CAGR) ⓘ | 5.11% | 6.02% |
| EPS Growth (5Y CAGR) ⓘ | -15.10% | -11.37% |
| BVPS Growth (5Y CAGR) ⓘ | -1.77% | 0.45% |
| Margin Growth (5Y Trend) ⓘ | -8.99% | -0.22% |
| FCF Growth (5Y CAGR) ⓘ | 3.93% | 5.40% |
| DPS Growth (5Y CAGR) ⓘ | 10.24% | 5.02% |
Quality (Business durability) | ||
| ROIC (Latest) ⓘ | 5.45% | 5.69% |
| ROE (Latest) ⓘ | 7.33% | 7.56% |
| ROA (Latest) ⓘ | 3.37% | 2.85% |
| ROIC (5Y Median) ⓘ | 6.71% | 4.22% |
| ROE (5Y Median) ⓘ | 8.92% | 6.03% |
| ROA (5Y Median) ⓘ | 4.75% | 2.44% |
| Net Debt / EBIT (Latest) ⓘ | 9.12 | 7.59 |
| Net Debt / EBIT (5Y Median) ⓘ | 6.29 | 8.40 |
| Net Debt / EBITDA (Latest) ⓘ | 4.48 | 5.27 |
| Net Debt / Assets ⓘ | 47.02% | 37.76% |
| EBITDA / Interest ⓘ | 6.32 | 4.10 |
| Operating Margin (Latest) ⓘ | 27.88% | 35.29% |
| Operating Margin (5Y Median) ⓘ | 33.52% | 37.31% |
| Debt to Equity (Latest) ⓘ | 104.75% | 88.87% |
| Profit Margin (Latest) ⓘ | 18.17% | 19.61% |
| Free Cash Flow (Latest) ⓘ | $569.35M | |
Momentum (Price trend) | ||
| 3Y Return ⓘ | -0.03% | +30.75% |
| 12M Return (excl. last month) ⓘ | -7.26% | +4.36% |
| 6M Return ⓘ | -4.02% | -2.52% |
| Price vs. 200-Day MA ⓘ | -8.30% | -2.34% |
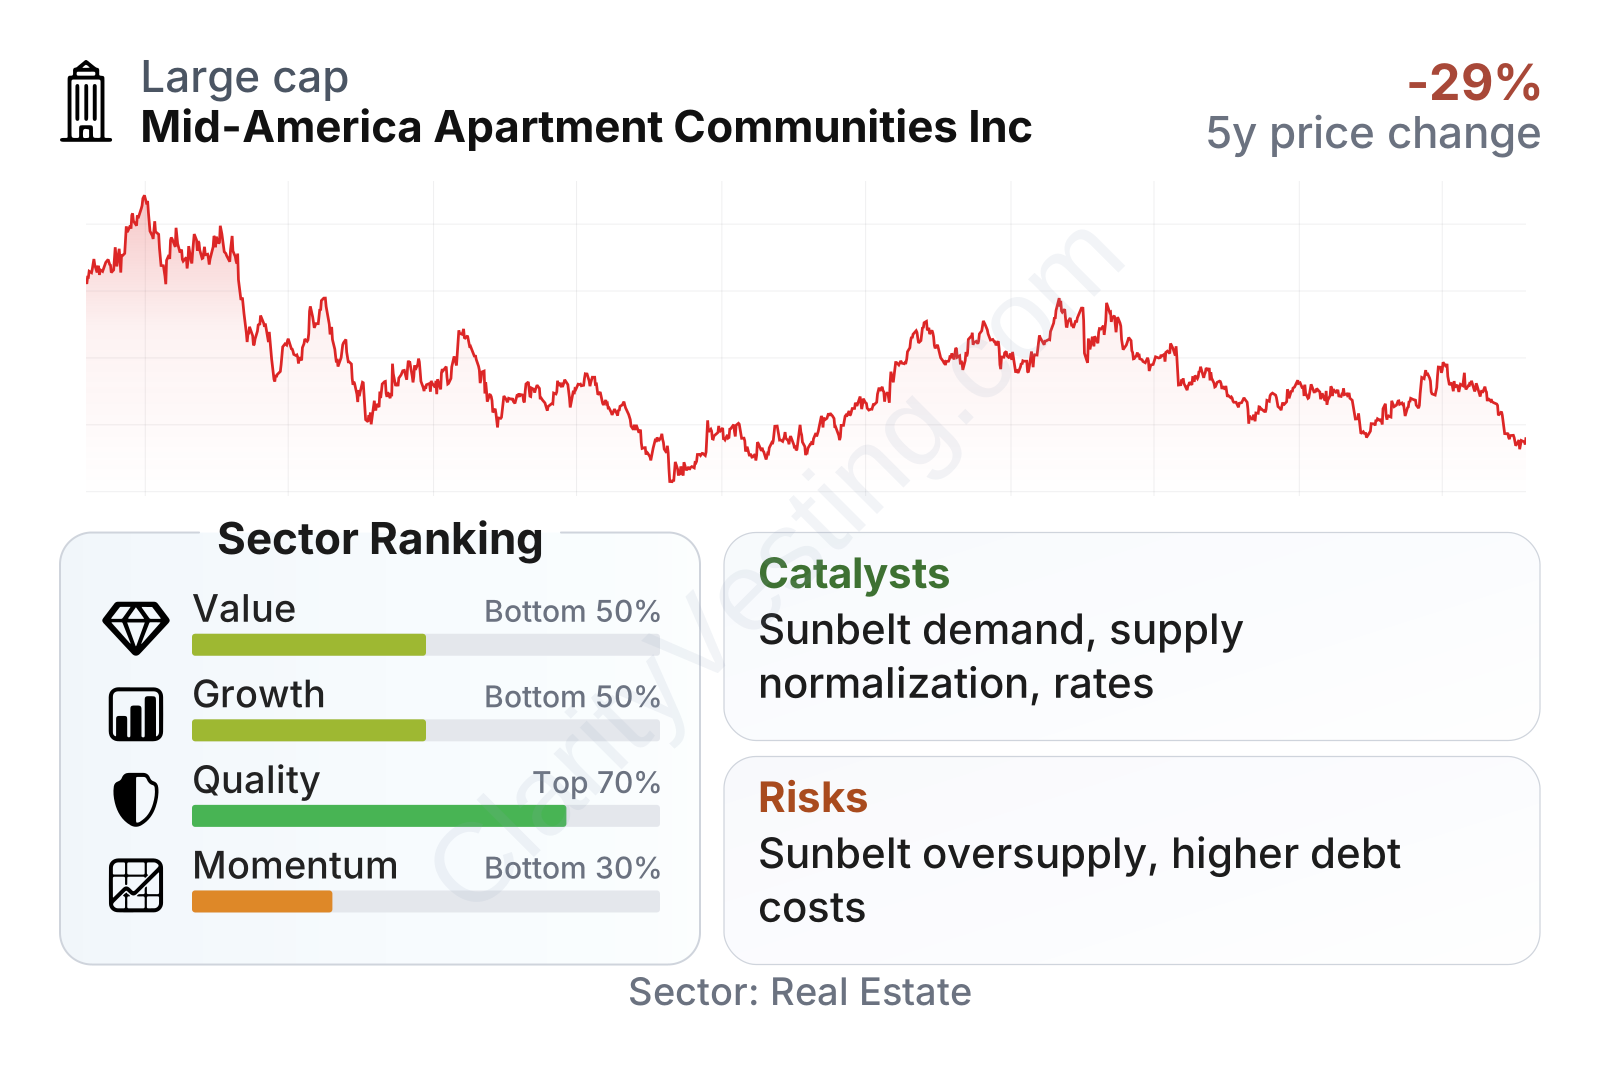
MAA is a large residential REIT with relatively low share-price volatility, as shown by a beta well below 1. On fundamentals, the picture is mixed. Quality metrics remain solid for the sector, especially asset profitability and interest coverage, but growth and momentum are weaker than many peers. Valuation also does not screen as cheap on common measures: the earnings multiple and price-to-book ratio sit clearly above sector medians, while free cash flow yield is lower than average. The dividend yield is somewhat above the sector median, which helps offset slower recent operating growth, but overall the metrics point to a company that looks stable rather than fast-moving.
Recent stock performance has also been restrained. The shares remain below the 2021 peak and recent returns have lagged the broader real estate peer group. That usually reflects a market that is waiting for a clearer acceleration in apartment fundamentals, lower interest-rate pressure, or stronger earnings momentum before assigning a richer premium.
Growth
The apartment sector remains structurally supported by long-term housing demand. In the United States, home affordability has become more difficult because of higher mortgage rates, elevated home prices, and still-tight housing supply in many desirable metro areas. That backdrop tends to support apartment demand, especially in job-rich Sunbelt cities where population and business migration have been strong for years. MAA is positioned directly in that trend.
The company’s strategy also makes sense for future growth. MAA concentrates on markets with favorable population inflows, employment growth, and business-friendly conditions. Management has historically emphasized disciplined development, selective acquisitions, redevelopment of existing communities, and capital recycling through occasional dispositions. That approach is more measured than aggressive expansion for its own sake, which can be useful in real estate where buying or building at the wrong point in the cycle can destroy returns for years.
Revenue per share has climbed steadily over the past five years, although the pace has slowed recently. That matters because it shows that growth has not depended only on issuing more shares or making large acquisitions; the underlying portfolio has become more productive on a per-share basis. Even so, the flattening in the most recent years indicates that the easy phase of rent growth is over and that future gains will likely depend more on occupancy discipline, expense control, and well-timed new supply absorption in its markets.
Dividend per share has risen strongly over the same period, with a five-year growth rate that stands out positively versus much of the sector. For a residential REIT, that is an important sign of cash-generation resilience. It does not mean growth will remain at the same pace, but it does show that MAA has been able to translate apartment income into steadily higher shareholder distributions through different market conditions.
As for catalysts, one of the biggest is the eventual normalization of new apartment supply in several Sunbelt markets. Many of MAA’s regions have recently faced elevated deliveries of new units, which has pressured rent growth. As that supply wave gets absorbed, pricing conditions can improve. A second catalyst is interest rates: if borrowing conditions ease or stabilize, apartment REIT valuations and development economics typically improve. A third is internal execution, including lease renewals, occupancy management, and redevelopment returns on existing communities.
Recent company updates have also pointed to continued portfolio reshaping and development activity rather than any dramatic strategic shift. That is generally consistent with a company preparing for a more favorable supply environment later rather than chasing short-term volume.
Risks
This article is for informational purposes only and does not constitute financial advice. Some content is AI-generated. See Disclaimer


