Stock Analysis · Lynas Rare Earths Ltd (LYSCF)
Overview
Lynas Rare Earths Ltd is a rare earth materials company focused on mining, processing, and refining rare earth elements used in permanent magnets and other advanced industrial applications. These materials are important in electric vehicles, wind turbines, industrial motors, electronics, and some defense-related systems. Lynas is unusual because it is one of the few large-scale rare earth producers outside China with commercial operations already in place.
The company’s main upstream asset is the Mt Weld mine in Western Australia, widely recognized as a high-grade rare earth deposit. Lynas then processes that material mainly in Malaysia and is also expanding processing capacity in Australia and the United States. In practical terms, Lynas earns money by extracting rare earth ore, concentrating it, and selling refined rare earth products to manufacturers and industrial customers.
Based on recent annual disclosures, revenue is heavily concentrated in rare earth product sales, with NdPr products forming the core earnings base. A simple way to think about the business is:
- NdPr oxide and related magnet rare earth products: approximately 70% to 80% of revenue in recent periods. This is the most valuable part of the portfolio because neodymium and praseodymium are key inputs for high-performance permanent magnets.
- SEG/HRE products and other rare earth compounds: approximately 15% to 25% of revenue. This includes products containing samarium, europium, gadolinium and heavier rare earth outputs, depending on production mix and market demand.
- Other revenue: usually a small remainder, generally below 10%, including by-products, service-related items, and timing-related sales mix effects.
This concentration matters. Lynas is not a diversified mining group with many commodities balancing each other out. It is largely tied to the rare earth market, especially the magnet materials chain.
Over the last several years, the company’s financial profile has moved in clear cycles. Revenue and profit surged when rare earth prices were strong, then compressed sharply as pricing weakened, and more recently recovered. The latest annual picture shows a strong rebound in sales and earnings from the depressed 2025 level, but not the same exceptionally high profitability seen in 2022.
The long-term pattern shows a highly cyclical income statement. Revenue in fiscal 2026 climbed back close to prior peak levels, and operating profit recovered sharply from fiscal 2025, but margins remain far more sensitive to rare earth pricing than those of a typical industrial company. That makes output growth important, but pricing remains the biggest driver.
Key Figures
| Metric | Value | Sector ⓘ |
|---|---|---|
| Date | Oct 17, 2026 | |
| Context | ||
| Sector | Basic Materials | |
| Industry | Other Industrial Metals & Mining | |
| Market Cap ⓘ | $8.15B | |
| Beta ⓘ | 0.73 | |
Value (Cheapness) | ||
| P/E Ratio ⓘ | 54.00 | 16.90 |
| P/B Ratio ⓘ | 2.27 | 1.65 |
| FCF Yield ⓘ | -1.95% | 5.76% |
| Dividend Yield ⓘ | N/A | 2.13% |
| EBIT / EV ⓘ | N/A | 6.30% |
| PEG ⓘ | N/A | |
Growth (Business expansion) | ||
| Revenue Growth ⓘ | 86.70% | 11.10% |
| RPS Growth (5Y CAGR) ⓘ | -1.17% | 4.49% |
| EPS Growth (5Y CAGR) ⓘ | -30.13% | -13.47% |
| BVPS Growth (5Y CAGR) ⓘ | 17.47% | 5.51% |
| Margin Growth (5Y Trend) ⓘ | -32.39% | -1.54% |
| FCF Growth (5Y CAGR) ⓘ | -11.32% | 0.37% |
| DPS Growth (5Y CAGR) ⓘ | N/A | 6.08% |
Quality (Business durability) | ||
| ROIC (Latest) ⓘ | N/A | 9.26% |
| ROA (Latest) ⓘ | 6.36% | 4.91% |
| ROIC (5Y Median) ⓘ | 6.84% | 7.70% |
| ROA (5Y Median) ⓘ | 6.11% | 3.86% |
| Net Debt / EBIT (Latest) ⓘ | -0.66 | 1.40 |
| Net Debt / EBIT (5Y Median) ⓘ | -1.48 | 1.70 |
| Net Debt / EBITDA (Latest) ⓘ | -0.35 | 0.95 |
| Net Debt / Assets ⓘ | -3.83% | 13.69% |
| EBITDA / Interest ⓘ | 22.63 | 12.34 |
| Operating Margin (Latest) ⓘ | 16.36% | 13.20% |
| Operating Margin (5Y Median) ⓘ | 24.66% | 11.80% |
| Debt to Equity (Latest) ⓘ | 9.69% | 40.56% |
| Profit Margin (Latest) ⓘ | 22.74% | 6.43% |
| Free Cash Flow (Latest) ⓘ | -$158.87M | |
Momentum (Price trend) | ||
| 3Y Return ⓘ | +83.65% | +68.89% |
| 12M Return (excl. last month) ⓘ | +6.17% | +30.21% |
| 6M Return ⓘ | -50.06% | -4.16% |
| Price vs. 200-Day MA ⓘ | -34.67% | -1.27% |
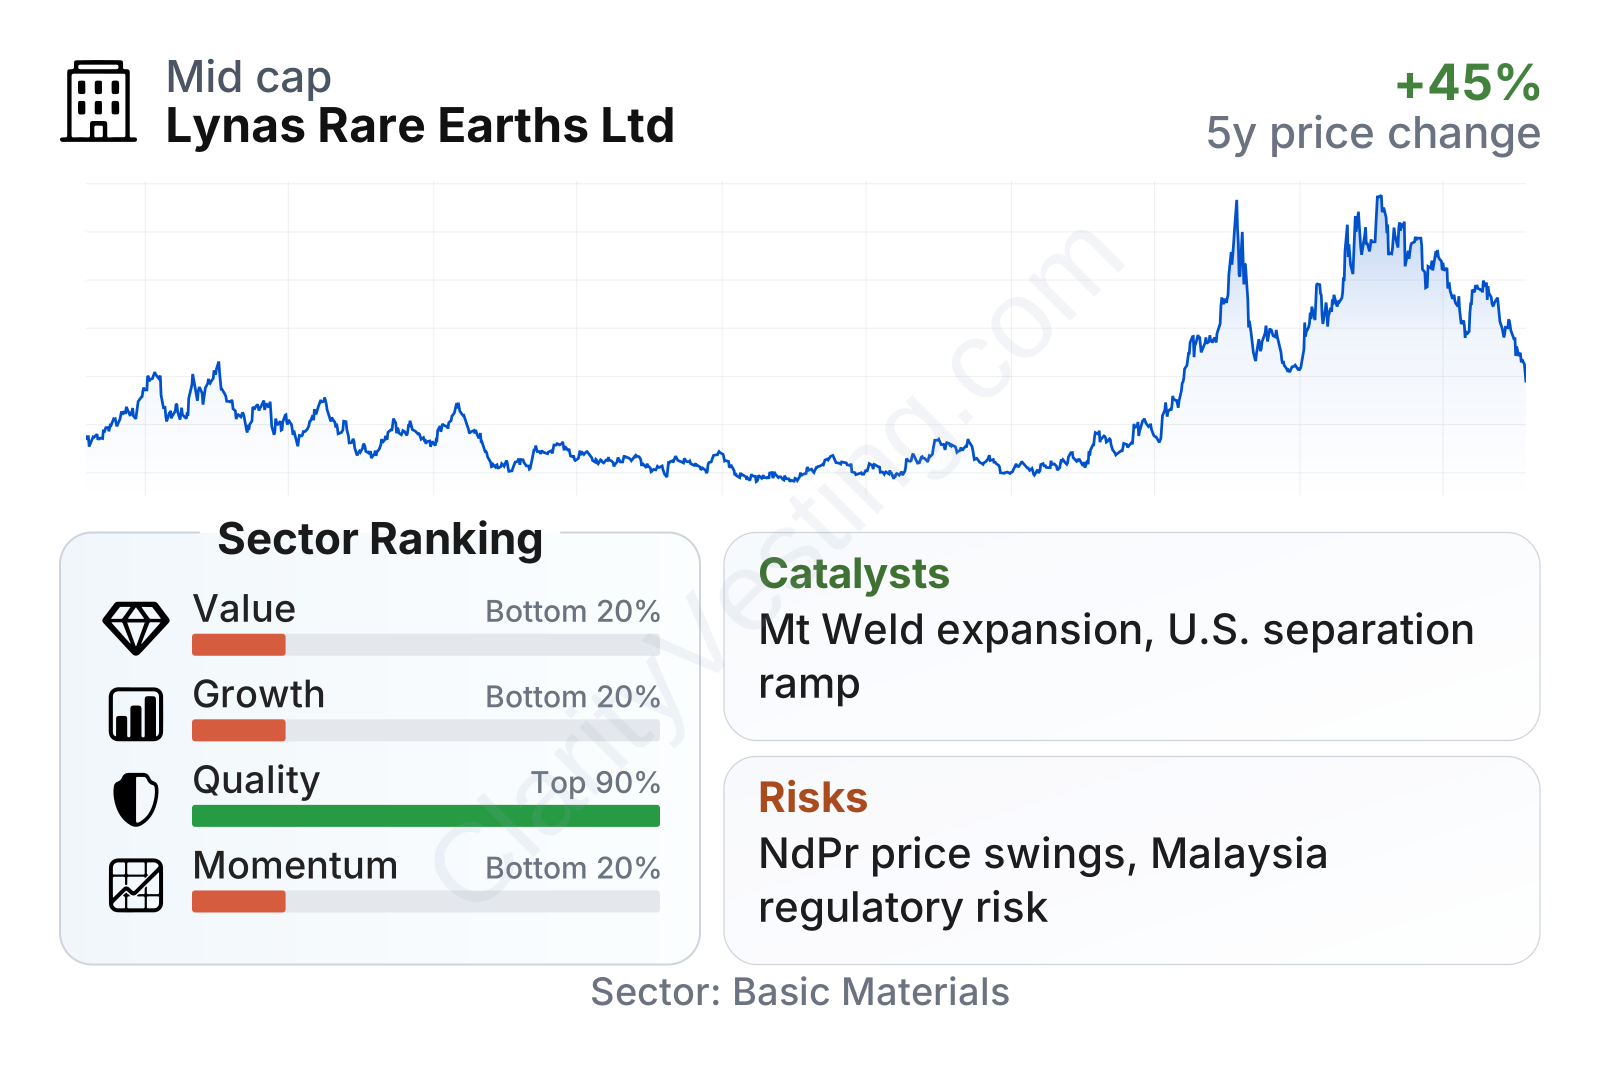
Lynas sits in an unusual position: balance-sheet quality is strong compared with much of the materials sector, but valuation and recent cash generation look much less comfortable. The company is large for a specialized rare earth producer, its share price has been volatile, and recent performance reflects both strong recovery expectations and the market’s tendency to reprice rare earth names quickly when sentiment shifts.
The table points to a mixed profile. Profitability metrics remain solid versus sector medians, debt is very low, and net debt measures are better than many peers because the company still carries significant financial flexibility. At the same time, traditional valuation measures are elevated, free cash flow is currently negative, and long-term growth metrics look weaker than the latest year-over-year rebound suggests. In short, the business quality looks stronger than the valuation profile.
Growth
The sector backdrop is attractive over the long run. Rare earth demand is supported by the spread of electric vehicles, wind power, robotics, factory automation, and defense supply chain localization. Among rare earths, NdPr has the clearest structural demand case because permanent magnets are difficult to replace in many high-performance applications. That gives Lynas exposure to markets that are expected to expand over time, even if prices move in sharp cycles from year to year.
Lynas’s strategy broadly makes industrial sense. It is not trying to become a general miner; it is building deeper control over a strategically important niche. The company already operates one of the few established ex-China rare earth supply chains, and its current projects aim to increase scale and improve geopolitical relevance. These include processing expansion in Australia, heavy rare earth capability, and participation in a U.S. rare earth separation project. That combination could make Lynas more valuable to customers and governments that want alternative supply sources.
Recent revenue growth shows a sharp swing from contraction to recovery. That rebound is encouraging, but it should be read carefully: part of the improvement comes from recovering conditions after a weak period rather than from a smooth, steady growth path. For a cyclical materials company, one strong year does not erase the uneven trend seen over the last five years.
Cash flow is the main point where the growth case becomes more complicated. Lynas has been investing in additional capacity and downstream capability, which can strengthen its long-term position, but it also means growth is currently consuming cash rather than consistently producing it. That is not automatically negative for a strategic materials company, yet it raises the importance of execution and commodity pricing.
Recent company updates also support the view that Lynas has meaningful catalysts. Progress at Mt Weld expansion, the Kalgoorlie processing development, and the U.S. rare earth separation facility all matter because they can increase output, improve product mix, and widen the company’s role in Western supply chains. Another important catalyst is any sustained improvement in NdPr pricing. Because Lynas already has operating assets, higher prices can have a powerful effect on profit once fixed costs are covered.
Risks
This article is for informational purposes only and does not constitute financial advice. Some content is AI-generated. See Disclaimer


