Stock Analysis · LATAM Airlines Group S.A (LTM)
Overview
LATAM Airlines Group S.A. is one of the largest airline groups in Latin America. It operates passenger and cargo air transportation across South America, North America, Europe, and other international routes, using a multi-hub network centered mainly in Chile, Brazil, Peru, Colombia, and Ecuador. In simple terms, the company makes money by flying people and goods, while also earning smaller amounts from loyalty-related and ancillary activities.
The business is still primarily a passenger airline, but cargo has become an important complementary source of earnings, especially because LATAM has a strong regional network and dedicated freighter operations. Based on the company’s recent annual reporting structure, revenue can be broadly understood as coming from the following sources:
- Passenger revenue: about 80% to 85% — ticket sales for domestic and international travel, including economy and premium cabins.
- Cargo revenue: about 10% to 15% — freight transportation using both dedicated cargo aircraft and belly space on passenger flights.
- Other revenue: about 3% to 7% — mainly ancillary services such as baggage, seat selection, loyalty-related arrangements, and other service items.
Geographically, LATAM is especially exposed to Latin American air travel demand, with Brazil as a particularly important market. That gives it a strong position in a region where air travel penetration still has room to expand over the long run, but it also means results are influenced by local currencies, economic cycles, and regulation across several countries.
Over the last few years, the company has moved from crisis recovery to a more normalized operating profile. Revenue, operating income, and net income all improved sharply from the pandemic period through 2025, while interest expense remained meaningful but more manageable relative to earnings than during the restructuring phase. The broad picture is one of a business that has rebuilt scale and restored profitability.
The long-term trend shown here is a clear recovery: revenue has climbed well above pre-recovery levels, operating profit has turned positive, and net income has improved materially since 2021. The remaining constraint is that financing costs are still significant for an airline, which keeps balance-sheet discipline central to the investment case.
Key Figures
| Metric | Value | Sector ⓘ |
|---|---|---|
| Date | Oct 24, 2026 | |
| Context | ||
| Sector | Industrials | |
| Industry | Airlines | |
| Market Cap ⓘ | $13.98B | |
| Beta ⓘ | 0.84 | |
Value (Cheapness) | ||
| P/E Ratio ⓘ | 9.01 | 22.29 |
| P/B Ratio ⓘ | 6.85 | 1.98 |
| FCF Yield ⓘ | 13.77% | 6.26% |
| Dividend Yield ⓘ | N/A | 1.92% |
| EBIT / EV ⓘ | 10.91% | 4.83% |
| PEG ⓘ | 2.58 | |
Growth (Business expansion) | ||
| Revenue Growth ⓘ | 27.20% | 9.30% |
| RPS Growth (5Y CAGR) ⓘ | -51.82% | 7.76% |
| EPS Growth (5Y CAGR) ⓘ | N/A | -13.17% |
| BVPS Growth (5Y CAGR) ⓘ | N/A | 6.13% |
| Margin Growth (5Y Trend) ⓘ | 84.70% | 0.74% |
| FCF Growth (5Y CAGR) ⓘ | N/A | 10.79% |
| DPS Growth (5Y CAGR) ⓘ | N/A | 9.41% |
Quality (Business durability) | ||
| ROIC (Latest) ⓘ | 51.65% | 10.75% |
| ROA (Latest) ⓘ | 8.54% | 5.41% |
| ROIC (5Y Median) ⓘ | N/A | 9.37% |
| ROA (5Y Median) ⓘ | 6.53% | 4.95% |
| Net Debt / EBIT (Latest) ⓘ | 2.75 | 2.04 |
| Net Debt / EBIT (5Y Median) ⓘ | 2.70 | 2.27 |
| Net Debt / EBITDA (Latest) ⓘ | 1.85 | 1.39 |
| Net Debt / Assets ⓘ | 32.44% | 19.27% |
| EBITDA / Interest ⓘ | 5.48 | 9.58 |
| Operating Margin (Latest) ⓘ | 14.62% | 10.49% |
| Operating Margin (5Y Median) ⓘ | 14.14% | 10.30% |
| Debt to Equity (Latest) ⓘ | 450.98% | 64.82% |
| Profit Margin (Latest) ⓘ | 9.85% | 6.67% |
| Free Cash Flow (Latest) ⓘ | $1.93B | |
Momentum (Price trend) | ||
| 3Y Return ⓘ | N/A | +67.77% |
| 12M Return (excl. last month) ⓘ | +16.37% | +12.05% |
| 6M Return ⓘ | -8.67% | 0.00% |
| Price vs. 200-Day MA ⓘ | -9.49% | +0.67% |
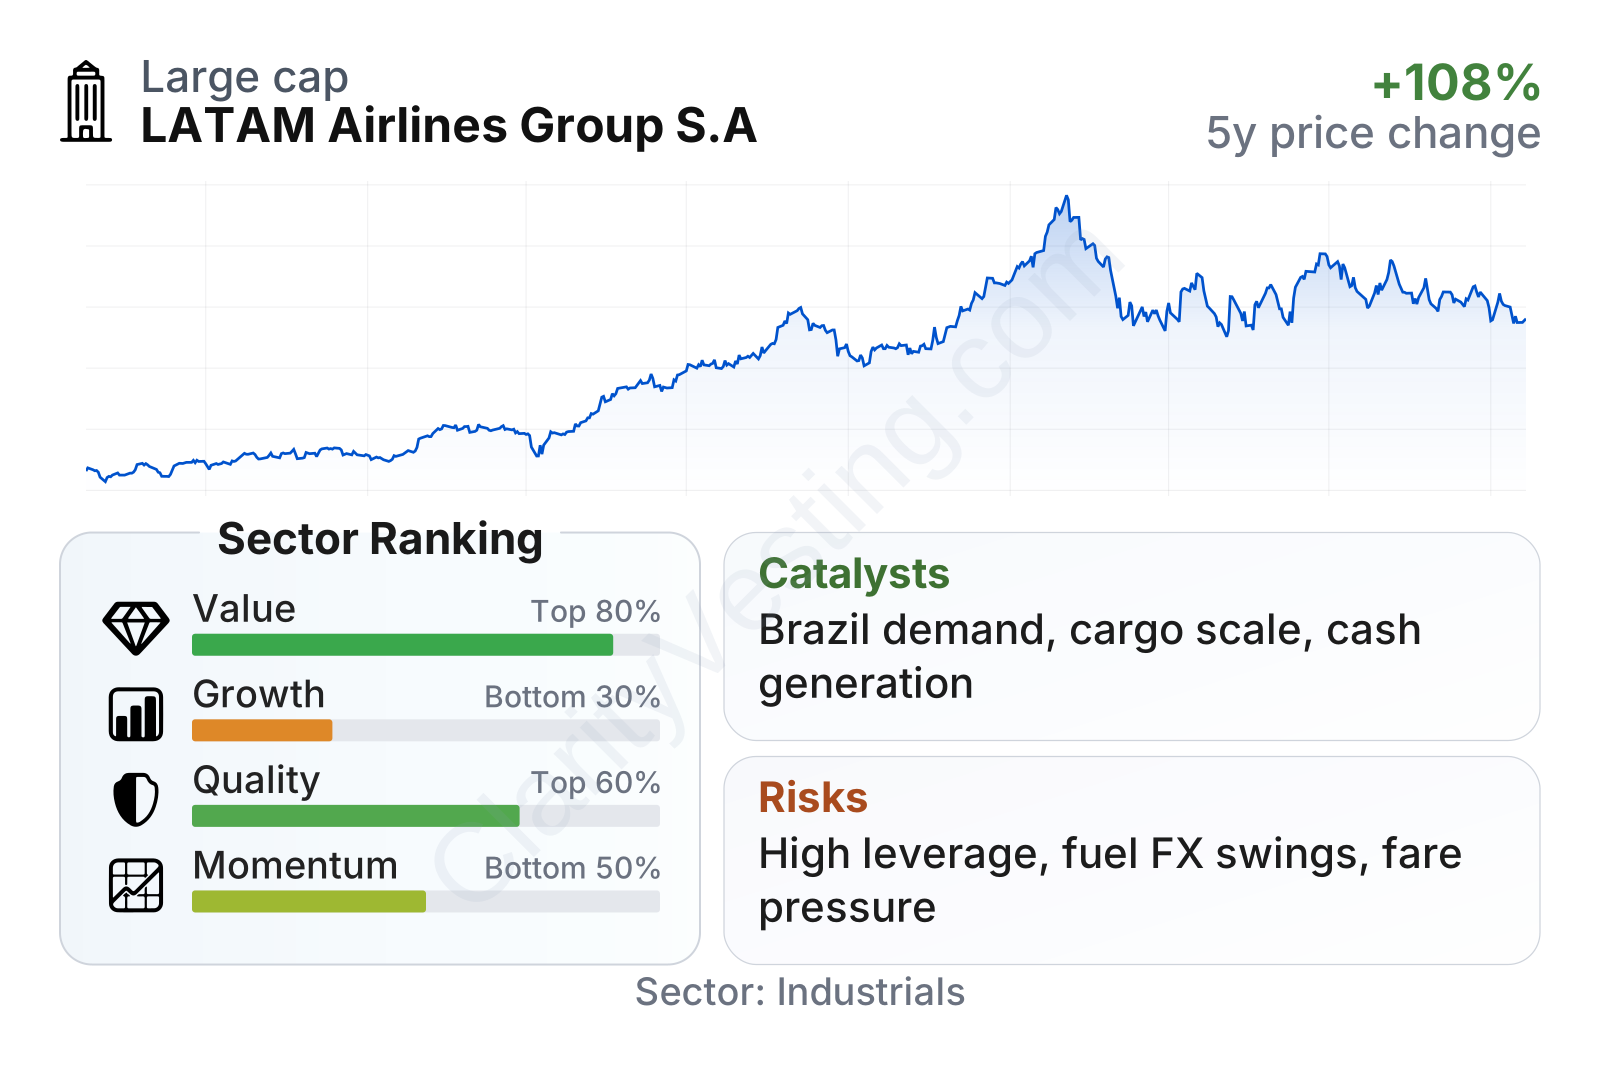
LATAM is now a large airline company by market value, and the stock has been volatile, which is normal for the sector. The metrics paint an interesting mix: profitability and cash generation look strong relative to many industrial peers, while leverage remains heavier than sector norms. On valuation measures tied to earnings and cash flow, the shares screen cheaper than the sector median, but the high price-to-book ratio reflects the airline’s capital structure rather than a simple premium for growth. Growth and momentum factors are less convincing than quality and value factors, which suggests the market is recognizing the recovery but still applying caution.
Growth
Air travel remains a structurally growing industry over the long term, especially in emerging regions where rising income levels and cross-border mobility can support higher passenger volumes over time. Latin America fits that description better than many mature aviation markets. Demand can be uneven from year to year, but the broader backdrop remains favorable: more tourism, more business travel within the region, and more cargo flows linked to trade and e-commerce.
LATAM’s strategy appears aligned with that backdrop. The company has focused on restoring capacity, improving network efficiency, strengthening its core hubs, and keeping cargo as a meaningful second engine. It also benefits from participation in major alliance and partnership arrangements, which helps it feed traffic across international routes without needing to operate every route alone. That matters because scale and connectivity are major advantages in aviation.
Recent revenue growth has accelerated noticeably, moving from low single-digit rates into a much stronger range during the latest periods. That suggests LATAM is not only recovering from past disruption but still expanding at a pace ahead of many sector peers. Even though airline growth can be cyclical, the recent trajectory points to healthy demand and effective capacity deployment.
Cash generation is another encouraging point. Free cash flow has remained solid and has improved over time, which is important because airlines need cash to fund aircraft commitments, maintenance, and debt reduction. Strong free cash flow gives LATAM more flexibility to manage its fleet, navigate volatility, and support shareholder distributions when conditions allow.
A practical catalyst for future growth is the company’s ability to keep improving mix and utilization rather than relying only on adding more planes. Better load factors, premium demand, ancillary revenue, and cargo efficiency can all lift earnings even if industry capacity growth slows. Another potential support is continued normalization of travel patterns across South America and long-haul international markets.
Recent company updates have also highlighted continued operational and financial normalization, including profitability levels that compare favorably with many airlines globally. That does not eliminate cyclicality, but it does suggest LATAM has emerged from restructuring with a clearer and more disciplined framework than it had before.
Risks
This article is for informational purposes only and does not constitute financial advice. Some content is AI-generated. See Disclaimer


