Stock Analysis · Life Healthcare Group Holdings (LTGHY)
Overview
Life Healthcare Group Holdings is a South Africa-based private healthcare company that operates hospitals and related healthcare services. Its core business is providing acute hospital care, day surgery, mental health services, oncology, renal dialysis, and diagnostic imaging. The group is best known for its network of private hospitals in Southern Africa, serving insured and self-paying patients as well as working with medical schemes and other healthcare funders.
The business has also had an international diagnostic services presence through Alliance Medical Group, which focuses on imaging services such as MRI, CT, and PET-CT scanning in parts of Europe. That matters because the company has historically combined a relatively stable hospital business in South Africa with a more complex imaging business abroad, creating a mix of defensive healthcare demand and operational restructuring risk.
Based on recent annual reporting, revenue is mainly generated from healthcare services rather than product sales. The largest sources are broadly structured as follows:
- Hospital and complementary healthcare services in Southern Africa: approximately 70% to 80% of group revenue. This includes inpatient admissions, theater procedures, ICU and ward care, emergency services, mental health facilities, oncology, renal dialysis, and day hospitals.
- International diagnostic imaging services: approximately 20% to 30% of group revenue. This includes mobile and fixed-site imaging, radiopharmacy-related activities, and imaging services contracts, mainly through Alliance Medical.
That mix can shift meaningfully from year to year because portfolio changes, disposals, and currency movements have a visible effect on reported numbers. Even so, the central identity of the company remains clear: it is a healthcare facilities operator with recurring demand tied to hospital care and diagnostics.
The profit flow has been uneven over the last few years. Revenue has stayed in a fairly similar range, but operating profitability has been volatile, with a particularly weak operating result in the latest annual period despite still-meaningful net income. That pattern suggests one-off items, portfolio effects, or accounting adjustments played a large role, so headline earnings need to be read with more caution than usual.
Key Figures
| Metric | Value | Sector ⓘ |
|---|---|---|
| Date | Oct 17, 2026 | |
| Context | ||
| Sector | Healthcare | |
| Industry | Medical Care Facilities | |
| Market Cap ⓘ | $1.07B | |
| Beta ⓘ | 0.06 | |
Value (Cheapness) | ||
| P/E Ratio ⓘ | 13.59 | 24.79 |
| P/B Ratio ⓘ | 0.10 | 3.08 |
| FCF Yield ⓘ | 476.16% | 3.15% |
| Dividend Yield ⓘ | 4.75% | 1.94% |
| EBIT / EV ⓘ | N/A | 0.57% |
| PEG ⓘ | N/A | |
Growth (Business expansion) | ||
| Revenue Growth ⓘ | 2.30% | 7.45% |
| RPS Growth (5Y CAGR) ⓘ | -1.60% | 8.61% |
| EPS Growth (5Y CAGR) ⓘ | N/A | -17.81% |
| BVPS Growth (5Y CAGR) ⓘ | -12.37% | 3.72% |
| Margin Growth (5Y Trend) ⓘ | -11.89% | -0.62% |
| FCF Growth (5Y CAGR) ⓘ | -5.21% | 1.04% |
| DPS Growth (5Y CAGR) ⓘ | 72.96% | 6.77% |
Quality (Business durability) | ||
| ROIC (Latest) ⓘ | 19.29% | 3.24% |
| ROA (Latest) ⓘ | 25.01% | 3.01% |
| ROIC (5Y Median) ⓘ | 8.60% | 4.60% |
| ROA (5Y Median) ⓘ | 4.20% | 1.89% |
| Net Debt / EBIT (Latest) ⓘ | 1.31 | 1.34 |
| Net Debt / EBIT (5Y Median) ⓘ | 3.41 | 1.84 |
| Net Debt / EBITDA (Latest) ⓘ | 0.68 | 1.00 |
| Net Debt / Assets ⓘ | 15.58% | 5.45% |
| EBITDA / Interest ⓘ | 7.89 | 9.64 |
| Operating Margin (Latest) ⓘ | 5.39% | 9.27% |
| Operating Margin (5Y Median) ⓘ | 10.79% | 7.38% |
| Debt to Equity (Latest) ⓘ | 42.23% | 28.58% |
| Profit Margin (Latest) ⓘ | 26.69% | 3.59% |
| Free Cash Flow (Latest) ⓘ | $5.09B | |
Momentum (Price trend) | ||
| 3Y Return ⓘ | +67.40% | +42.80% |
| 12M Return (excl. last month) ⓘ | +14.84% | +18.50% |
| 6M Return ⓘ | +2.63% | +7.57% |
| Price vs. 200-Day MA ⓘ | +10.40% | +5.12% |
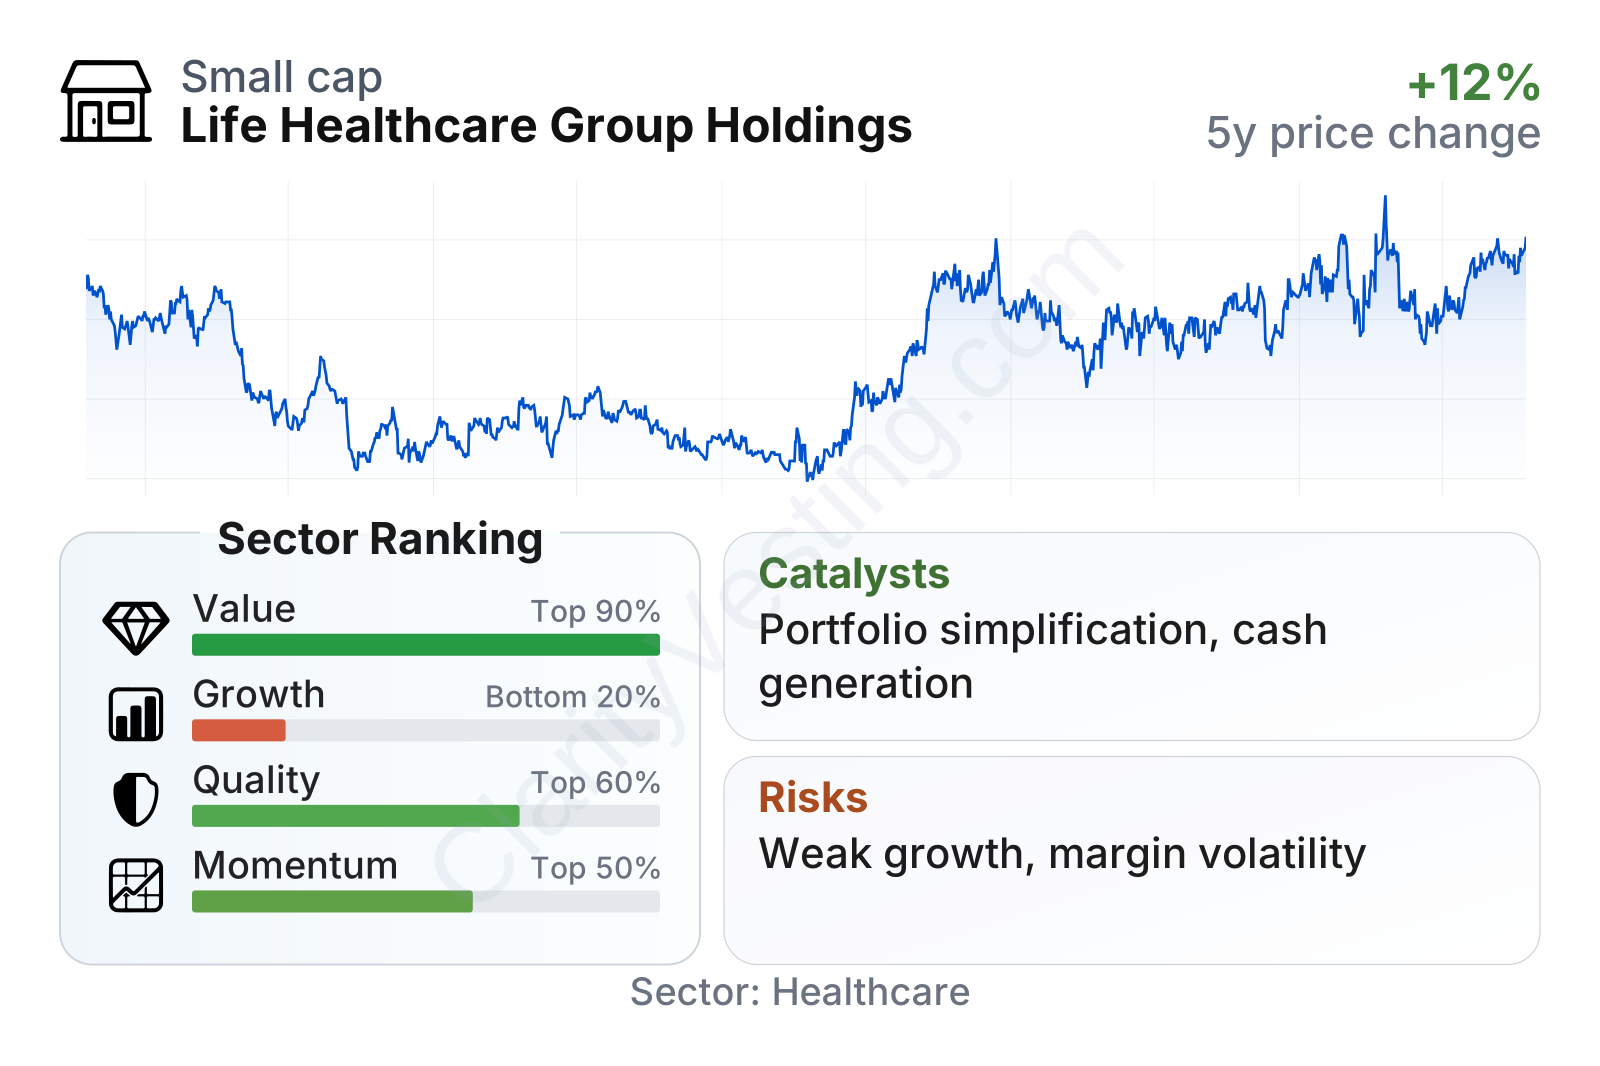
Life Healthcare is a mid-sized healthcare company in market value terms, and its share price has been relatively low-volatility, with a beta close to zero. On valuation measures, it screens cheaply versus much of the healthcare sector: earnings multiple is around the low teens, price-to-book is far below the sector median, and dividend yield is notably higher than the median. Profitability and capital returns look respectable, with return on invested capital and return on assets above typical sector levels, while leverage is manageable on an earnings basis. The weaker area is growth, where revenue expansion, book value progression, margin trend, and multi-year cash flow growth all lag the broader healthcare peer group.
The longer-term stock chart shows that the shares recovered from the lows reached in 2022 and 2023, then moved higher into 2024 and early 2026 before pulling back. That pattern fits a company the market sees as operationally resilient but still working through strategic and structural questions.
Growth
Healthcare is generally a favorable long-term sector because demand is supported by aging populations, chronic disease treatment, and the essential nature of hospital care. In South Africa, private hospital operators can also benefit from rising use of insured healthcare among middle- and upper-income patients, as well as ongoing demand for specialist procedures and diagnostics. Those are attractive structural tailwinds for Life Healthcare’s core operations.
Its strategy makes the most sense where it leans into that core: hospital services, day facilities, oncology, mental health, and diagnostics that are integrated with patient pathways. These businesses tend to have recurring demand and can benefit from scale, clinician relationships, and infrastructure that is difficult to replicate quickly.
A major issue is that group-level growth has not recently looked strong. Recent annual revenue movement has been modest to negative, and the latest year-over-year revenue trend points to contraction rather than expansion.
This softer top-line trend does not automatically mean the underlying hospital franchise is deteriorating. It may partly reflect portfolio changes, the overseas imaging business, and the impact of strategic repositioning. For long-term analysis, the key question is whether management can simplify the group and let the higher-quality hospital assets become more visible in the reported results.
One important catalyst has been the continued focus on reshaping the portfolio, especially around Alliance Medical. If the company can reduce complexity, improve margins, and direct capital toward its strongest Southern African healthcare assets, future results could become easier to understand and potentially more consistent. Another positive feature is cash generation: free cash flow remains meaningful, which gives the company room to support dividends, reduce debt, or reinvest in facilities.
Recent corporate updates have also kept attention on asset sales and strategic actions around non-core operations. For a business like Life Healthcare, that can matter more than raw revenue growth, because a cleaner structure may improve both financial quality and market confidence.
Risks
This article is for informational purposes only and does not constitute financial advice. Some content is AI-generated. See Disclaimer


