Stock Analysis · Land Securities Group plc (LSGOF)
Overview
Land Securities Group plc is one of the largest listed real estate owners and developers in the United Kingdom. It operates as a REIT, which means it owns income-producing properties and is structured to pass a large share of its earnings to shareholders through dividends. The company focuses mainly on major retail destinations, offices in London, and a smaller but growing residential-related development activity.
Its business model is straightforward: buy, develop, improve, lease, and occasionally sell properties in locations where demand is expected to stay strong over time. Rental income is the core engine, while development profits and changes in property values can make reported earnings more volatile from year to year.
Based on the latest annual reporting structure, Land Securities’ main sources of revenue are approximately:
- Retail rental and related income: about 45% to 50% — shopping centers, retail parks, outlet assets, and other retail-led destinations.
- Central London office rental and related income: about 35% to 40% — workspace in well-located London districts, often targeting higher-quality and more sustainable buildings.
- Residential, mixed-use, fees, and other income: about 10% to 20% — development management, mixed-use schemes, apartments or residential-led projects, and other property-related items.
This mix matters because it gives the group exposure to two different parts of the property market. Retail can benefit from scarcity of strong destinations and retail park demand, while London offices can benefit from companies seeking better-quality space in central locations.
The profit flow has been uneven in recent years because property valuation movements can push accounting profit sharply up or down. Even so, the underlying picture is that the company continues to generate substantial rental income and cash flow from a portfolio centered on large, hard-to-replicate assets.
The income profile shows a business with high gross margins and solid operating profitability in normal years, but also one whose reported earnings can swing when property values move. Revenue recovered to roughly the level seen several years ago by fiscal 2026, while interest expense remains meaningful because real estate is a capital-intensive business.
Key Figures
| Metric | Value | Sector ⓘ |
|---|---|---|
| Date | Oct 04, 2026 | |
| Context | ||
| Sector | Real Estate | |
| Industry | REIT - Diversified | |
| Market Cap ⓘ | $6.57B | |
| Beta ⓘ | 1.15 | |
Value (Cheapness) | ||
| P/E Ratio ⓘ | 13.01 | 17.35 |
| P/B Ratio ⓘ | 0.90 | 0.86 |
| FCF Yield ⓘ | 7.01% | 7.47% |
| Dividend Yield ⓘ | 14.90% | 4.75% |
| EBIT / EV ⓘ | N/A | 3.81% |
| PEG ⓘ | 12.72 | |
Growth (Business expansion) | ||
| Revenue Growth ⓘ | 0.40% | 5.30% |
| RPS Growth (5Y CAGR) ⓘ | -7.10% | 5.96% |
| EPS Growth (5Y CAGR) ⓘ | N/A | -11.41% |
| BVPS Growth (5Y CAGR) ⓘ | -17.05% | 0.41% |
| Margin Growth (5Y Trend) ⓘ | -7.02% | 0.53% |
| FCF Growth (5Y CAGR) ⓘ | 16.00% | 5.40% |
| DPS Growth (5Y CAGR) ⓘ | 3.55% | 5.02% |
Quality (Business durability) | ||
| ROIC (Latest) ⓘ | 7.70% | 5.77% |
| ROE (Latest) ⓘ | 11.34% | 7.64% |
| ROA (Latest) ⓘ | 6.65% | 2.85% |
| ROIC (5Y Median) ⓘ | 4.30% | 4.20% |
| ROE (5Y Median) ⓘ | 5.27% | 6.03% |
| ROA (5Y Median) ⓘ | 2.97% | 2.45% |
| Net Debt / EBIT (Latest) ⓘ | 4.85 | 7.57 |
| Net Debt / EBIT (5Y Median) ⓘ | 9.31 | 8.41 |
| Net Debt / EBITDA (Latest) ⓘ | 4.81 | 5.12 |
| Net Debt / Assets ⓘ | 37.94% | 37.84% |
| EBITDA / Interest ⓘ | 3.73 | 4.11 |
| Operating Margin (Latest) ⓘ | 52.15% | 35.40% |
| Operating Margin (5Y Median) ⓘ | 52.69% | 36.59% |
| Debt to Equity (Latest) ⓘ | 68.76% | 89.06% |
| Profit Margin (Latest) ⓘ | 38.45% | 19.99% |
| Free Cash Flow (Latest) ⓘ | $460.97M | |
Momentum (Price trend) | ||
| 3Y Return ⓘ | +38.43% | +30.66% |
| 12M Return (excl. last month) ⓘ | +32.66% | +7.55% |
| 6M Return ⓘ | +14.45% | +0.69% |
| Price vs. 200-Day MA ⓘ | +4.41% | -2.27% |
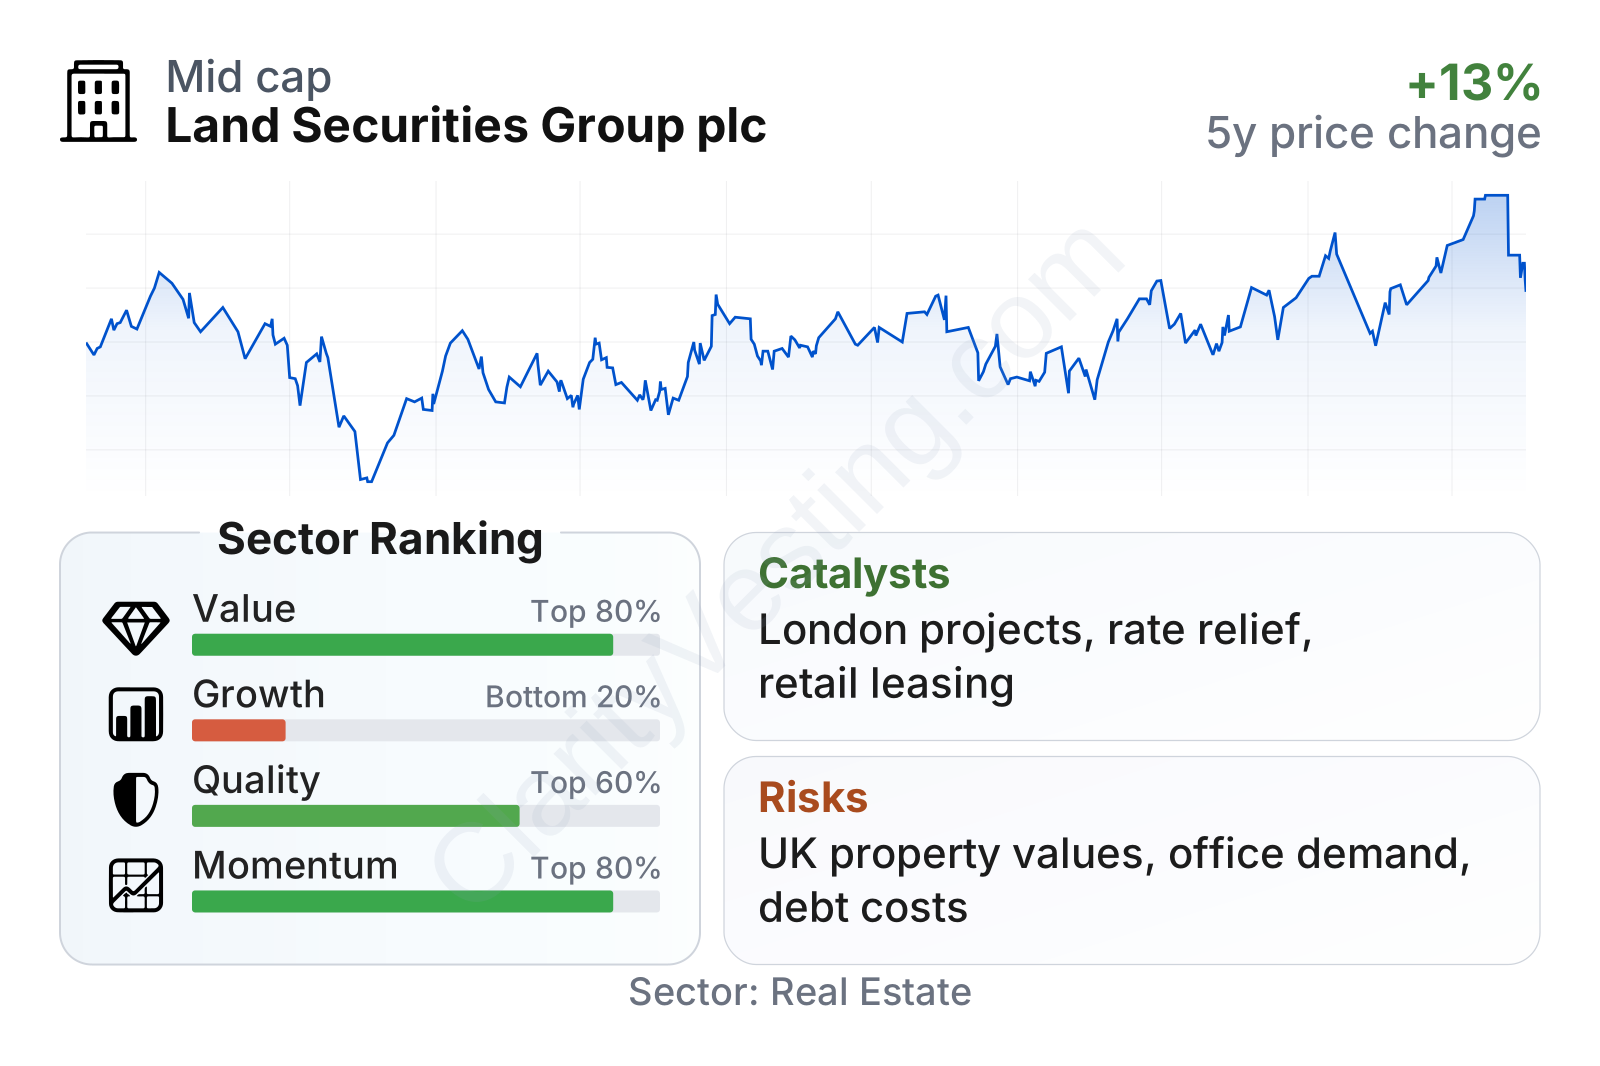
Land Securities is a large real estate company with share-price performance that has improved noticeably over the last 6 to 36 months. On valuation, its earnings multiple is below the sector median, while its price-to-book ratio is slightly above its own recent level but still below many peers in the wider property space. Profitability looks stronger than the sector median, with operating margin above 50% and returns on assets and equity also ahead of typical peers. Growth is the weakest area: revenue growth has been close to flat recently, and the longer-term trend in revenue per share and book value per share has been negative. Balance sheet metrics are mixed but broadly manageable for the sector, with leverage below the median on several measures and interest coverage adequate rather than exceptional.
Growth
Land Securities operates in a sector that is not a classic fast-growth industry, but it can still create value through redevelopment, better asset mix, rental uplifts, and disciplined capital allocation. In other words, this is more a business of asset quality and execution than one of rapid expansion.
The most important strategic point is the company’s tilt toward areas where supply is limited. In London offices, newer and more sustainable buildings are increasingly important as occupiers demand better energy efficiency and stronger amenities. In retail, the focus is not on weaker high-street assets but on larger destinations and retail parks that can keep attracting footfall and tenants. That gives Land Securities a more defensible platform than a broadly spread collection of average properties.
Another part of the strategy is active portfolio recycling: selling assets where upside looks limited and reinvesting into developments or sectors where management sees better long-term returns. For a property group, this can be a meaningful growth lever even when sector-wide demand is only moderate.
Revenue per share has been under pressure over the last several years, with fiscal 2026 below the levels reached in 2022 and 2023. That suggests growth has not yet consistently translated into stronger per-share economics, even though total revenue has stabilized. For long-term analysis, that is an important caution: the portfolio may be improving in quality, but the per-share output has not shown a durable upward trend.
The dividend record is more constructive than the revenue-per-share trend, with clear rebuilding from 2022 through 2025 before a pullback in 2026. This reflects both the income-producing nature of the assets and the reality that property cash flows can be influenced by financing costs, disposals, and development timing. A high trailing dividend yield stands out, but in property it is important to view that alongside rental growth, debt costs, and asset values rather than in isolation.
One visible catalyst is the possibility of improving property market conditions as interest rates stabilize or decline. Lower financing costs and firmer real estate valuations would help both sentiment and balance-sheet flexibility. A second catalyst is lease-up and completion of development projects in London and mixed-use schemes, which can raise rental income without requiring the company to rely only on acquisitions. A third is continued tenant demand for top-tier, well-located space, especially where environmental standards are becoming a bigger part of leasing decisions.
Risks
This article is for informational purposes only and does not constitute financial advice. Some content is AI-generated. See Disclaimer


