Stock Analysis · Liquidia Technologies Inc (LQDA)
Overview
Liquidia Technologies is a biotechnology company focused on treatments for pulmonary hypertension, a serious disease that raises blood pressure in the lungs and puts strain on the heart. Its main asset is YUTREPIA, an inhaled dry-powder form of treprostinil designed for patients with pulmonary arterial hypertension, or PAH, and pulmonary hypertension associated with interstitial lung disease, or PH-ILD. The company also owns a precision particle engineering platform called PRINT, but the business has become increasingly centered on commercializing YUTREPIA and expanding its reach.
For long-term readers, the business is easier to understand if it is viewed as a specialty pharmaceutical company moving from development into commercialization. That shift matters because the economics change sharply once a drug launch gains traction: revenue can scale much faster than research spending, but execution becomes more dependent on manufacturing, market access, and competition.
Based on recent company reporting, revenue is now dominated by product sales rather than older collaboration-style activities.
- Product revenue: approximately 95% to 98% of total revenue in the latest reported periods. This mainly reflects sales of YUTREPIA after launch.
- License and contract revenue: approximately 2% to 5%. This includes smaller legacy or collaboration-related items and is no longer the core economic driver.
That concentration makes Liquidia simpler to analyze than many small biotech companies: its future is tied above all to one commercial product, one disease area, and the company’s ability to convert clinical and legal progress into durable sales growth.
The financial flow shows a notable inflection. Revenue was modest for several years, then expanded sharply in 2025 as commercialization accelerated. At the same time, operating expenses remained very high, especially selling and administrative costs, which is typical for a company building a launch infrastructure around a newly commercial-stage medicine.
Key Figures
| Metric | Value | Sector ⓘ |
|---|---|---|
| Date | Oct 24, 2026 | |
| Context | ||
| Sector | Healthcare | |
| Industry | Drug Manufacturers - Specialty & Generic | |
| Market Cap ⓘ | $3.48B | |
| Beta ⓘ | 0.61 | |
Value (Cheapness) | ||
| P/E Ratio ⓘ | 26.26 | 25.42 |
| P/B Ratio ⓘ | 20.63 | 3.08 |
| FCF Yield ⓘ | 1.74% | 3.12% |
| Dividend Yield ⓘ | N/A | 1.85% |
| EBIT / EV ⓘ | 2.97% | 0.56% |
| PEG ⓘ | N/A | |
Growth (Business expansion) | ||
| Revenue Growth ⓘ | 1842.70% | 7.50% |
| RPS Growth (5Y CAGR) ⓘ | 63.30% | 8.60% |
| EPS Growth (5Y CAGR) ⓘ | N/A | -17.73% |
| BVPS Growth (5Y CAGR) ⓘ | -20.68% | 3.72% |
| Margin Growth (5Y Trend) ⓘ | N/A | -0.57% |
| FCF Growth (5Y CAGR) ⓘ | N/A | 0.96% |
| DPS Growth (5Y CAGR) ⓘ | N/A | 6.69% |
Quality (Business durability) | ||
| ROIC (Latest) ⓘ | 57.31% | 3.17% |
| ROA (Latest) ⓘ | 34.74% | 2.98% |
| ROIC (5Y Median) ⓘ | -33.59% | 4.56% |
| ROA (5Y Median) ⓘ | -36.80% | 1.87% |
| Net Debt / EBIT (Latest) ⓘ | -0.88 | 1.34 |
| Net Debt / EBIT (5Y Median) ⓘ | N/A | 1.86 |
| Net Debt / EBITDA (Latest) ⓘ | -0.87 | 1.00 |
| Net Debt / Assets ⓘ | -29.74% | 5.06% |
| EBITDA / Interest ⓘ | 6.68 | 9.55 |
| Operating Margin (Latest) ⓘ | 39.06% | 9.25% |
| Operating Margin (5Y Median) ⓘ | -263.11% | 7.33% |
| Debt to Equity (Latest) ⓘ | 66.09% | 26.68% |
| Profit Margin (Latest) ⓘ | 30.74% | 3.34% |
| Free Cash Flow (Latest) ⓘ | $60.51M | |
Momentum (Price trend) | ||
| 3Y Return ⓘ | +548.53% | +51.61% |
| 12M Return (excl. last month) ⓘ | +199.74% | +19.90% |
| 6M Return ⓘ | +7.10% | +10.10% |
| Price vs. 200-Day MA ⓘ | -26.54% | +6.44% |
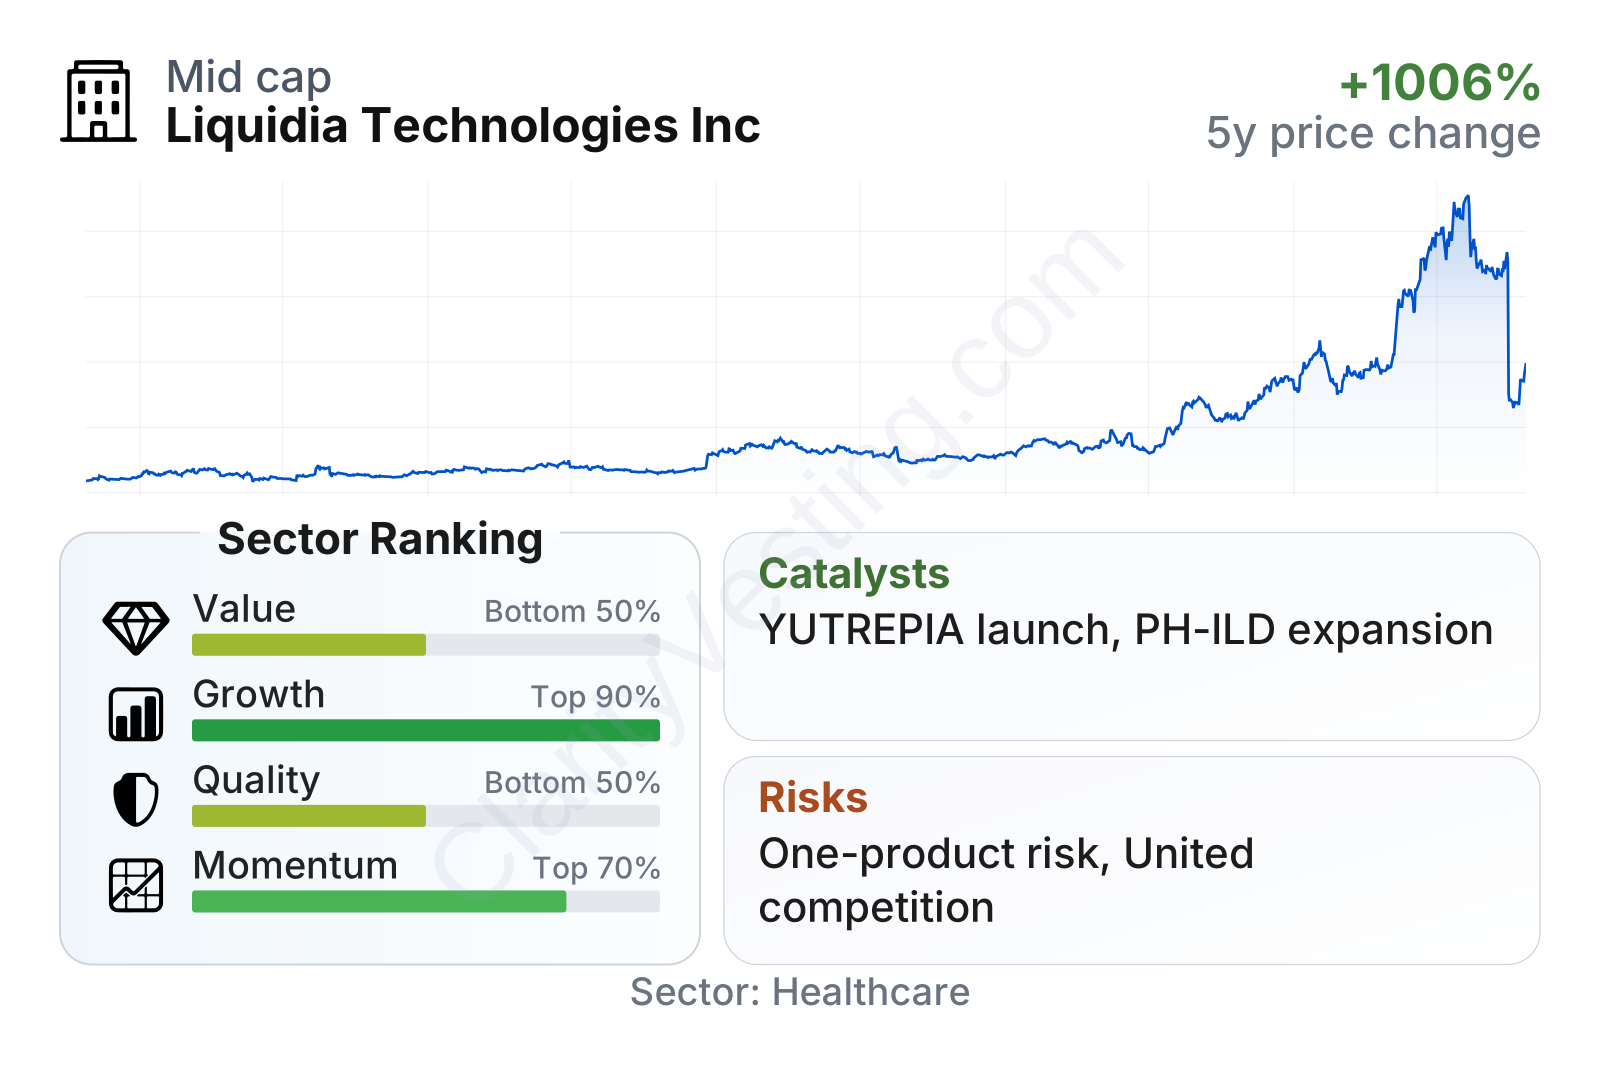
Liquidia is now a mid-sized biotechnology company by market value, and the stock has been extremely strong over the last three years. The table points to a mixed profile: growth and market momentum rank near the top of the healthcare sector, while value and consistency of quality metrics remain weaker. In plain English, the market is pricing in major progress, and recent operating results have improved quickly, but the valuation already reflects much of that optimism.
Growth
Liquidia operates in a market with attractive long-term drivers. Pulmonary hypertension remains a serious condition with significant unmet need, and therapies that improve convenience, tolerability, or patient access can gain traction even in a competitive field. That gives the company exposure to a specialized but valuable segment of rare-disease medicine, where pricing tends to be stronger and patient populations are clearly defined.
The company’s strategy is straightforward and makes sense on paper: establish YUTREPIA in PAH, expand reimbursement and physician adoption, and pursue broader use in PH-ILD. Management has also emphasized operational scaling, specialty pharmacy distribution, and payer access, all of which are essential for turning an approved therapy into a meaningful franchise rather than a niche launch.
The revenue trend is the clearest sign that the business has entered a new phase. After uneven results in earlier years, growth accelerated dramatically through 2025 and remained exceptionally high into 2026. Even allowing for a low base effect, this level of expansion is far above normal healthcare sector growth and supports the market’s view that YUTREPIA is gaining real commercial traction.
One of the most important recent catalysts has been regulatory and legal progress around YUTREPIA. The product received U.S. approval in 2025 for PAH and PH-ILD, ending a long period in which the company’s commercial timeline was constrained by patent and approval uncertainty. That change is significant because it moved Liquidia from a thesis built mainly on future possibility to one based on actual product sales.
Another growth element is the possibility of broader adoption against entrenched therapies. YUTREPIA uses dry-powder inhalation, which can be a more convenient format than nebulized delivery for some patients. In specialty medicine, ease of use matters because it can influence adherence, physician preference, and practical day-to-day uptake. If the product continues to show that convenience advantage in real-world use, it could support share gains over time.
Cash generation is improving, but it is not yet fully settled. Free cash flow was deeply negative during the buildout period, then moved much closer to break-even as revenue increased. That is encouraging because it suggests the company may be approaching a more self-funded operating model, although the path can still be volatile while launch spending, legal costs, and working capital fluctuate.
Risks
This article is for informational purposes only and does not constitute financial advice. Some content is AI-generated. See Disclaimer


