Stock Analysis · LPL Financial Holdings Inc (LPLA)
Overview
LPL Financial Holdings Inc. is one of the largest independent wealth management platforms in the United States. In simple terms, it provides the technology, brokerage, custody, compliance, and business support that financial advisors use to serve their own clients. Rather than mainly employing advisors in a traditional bank branch model, LPL focuses on independent advisors, registered investment advisory firms, and institutions that want outsourced wealth management infrastructure.
The company makes money from several streams tied to advisor assets, trading activity, and service fees. Based on recent annual reporting, the revenue mix is roughly structured as follows, from largest to smallest:
- Commission and advisory revenue: about 63% to 66% — fees tied to client assets in advisory programs, mutual fund and insurance trails, commissions on product sales, and transaction-related compensation.
- Asset-based revenue from cash sweep and client cash balances: about 18% to 22% — income earned on cash held in insured deposit accounts and other sweep arrangements, which tends to rise when client cash balances or interest rates are favorable.
- Service and fee revenue: about 10% to 13% — platform, technology, account servicing, and administrative fees charged to advisors and institutions.
- Other revenue: about 3% to 6% — smaller categories that can include sponsor-related revenue, interest, and miscellaneous items.
That structure matters because LPL is not a pure market-performance business. It benefits from a combination of rising client assets, advisor recruiting, more advisory relationships, and cash economics. This creates multiple ways to grow, although it also means earnings can be influenced by interest rates and market conditions.
The business has expanded significantly in recent years. Revenue climbed from roughly $7.7 billion in 2021 to nearly $17.0 billion in 2025, showing how strongly advisor assets, recruited teams, and acquired relationships have scaled. At the same time, the cost base has also grown, and recent profit conversion has been less smooth than top-line growth alone would suggest.
The longer-term picture shows a business that has become much larger, with gross profit rising materially over the last several years. However, interest expense and operating costs have also moved up, which helps explain why revenue growth has not translated into equally steady net income growth.
Key Figures
| Metric | Value | Sector ⓘ |
|---|---|---|
| Date | Oct 17, 2026 | |
| Context | ||
| Sector | Financial Services | |
| Industry | Capital Markets | |
| Market Cap ⓘ | $25.47B | |
| Beta ⓘ | 0.54 | |
Value (Cheapness) | ||
| P/E Ratio ⓘ | 25.88 | 12.26 |
| P/B Ratio ⓘ | 4.57 | 1.23 |
| FCF Yield ⓘ | -4.14% | 10.40% |
| Dividend Yield ⓘ | 0.37% | 3.02% |
| EBIT / EV ⓘ | 6.52% | 8.14% |
| PEG ⓘ | 0.39 | |
Growth (Business expansion) | ||
| Revenue Growth ⓘ | 36.40% | 9.35% |
| RPS Growth (5Y CAGR) ⓘ | 22.81% | 12.19% |
| EPS Growth (5Y CAGR) ⓘ | -0.21% | -9.53% |
| BVPS Growth (5Y CAGR) ⓘ | 34.86% | 4.99% |
| Margin Growth (5Y Trend) ⓘ | -0.00% | -3.86% |
| FCF Growth (5Y CAGR) ⓘ | N/A | 4.81% |
| DPS Growth (5Y CAGR) ⓘ | 5.07% | 8.79% |
Quality (Business durability) | ||
| ROIC (Latest) ⓘ | 11.35% | 9.49% |
| ROE (Latest) ⓘ | 18.65% | 13.90% |
| ROA (Latest) ⓘ | 5.32% | 1.55% |
| ROIC (5Y Median) ⓘ | 17.80% | 7.86% |
| ROE (5Y Median) ⓘ | 42.26% | 12.17% |
| ROA (5Y Median) ⓘ | 8.93% | 1.30% |
| Net Debt / EBIT (Latest) ⓘ | 2.43 | 0.96 |
| Net Debt / EBIT (5Y Median) ⓘ | 2.87 | 0.73 |
| Net Debt / EBITDA (Latest) ⓘ | 1.79 | 0.92 |
| Operating Margin (Latest) ⓘ | 9.99% | 22.30% |
| Operating Margin (5Y Median) ⓘ | 13.46% | 24.63% |
| Debt to Equity (Latest) ⓘ | 129.59% | 58.56% |
| Profit Margin (Latest) ⓘ | 5.24% | 26.57% |
| Free Cash Flow (Latest) ⓘ | -$1.05B | |
Momentum (Price trend) | ||
| 3Y Return ⓘ | +42.86% | +88.33% |
| 12M Return (excl. last month) ⓘ | +1.87% | +19.38% |
| 6M Return ⓘ | -0.98% | +4.75% |
| Price vs. 200-Day MA ⓘ | +0.72% | +3.50% |
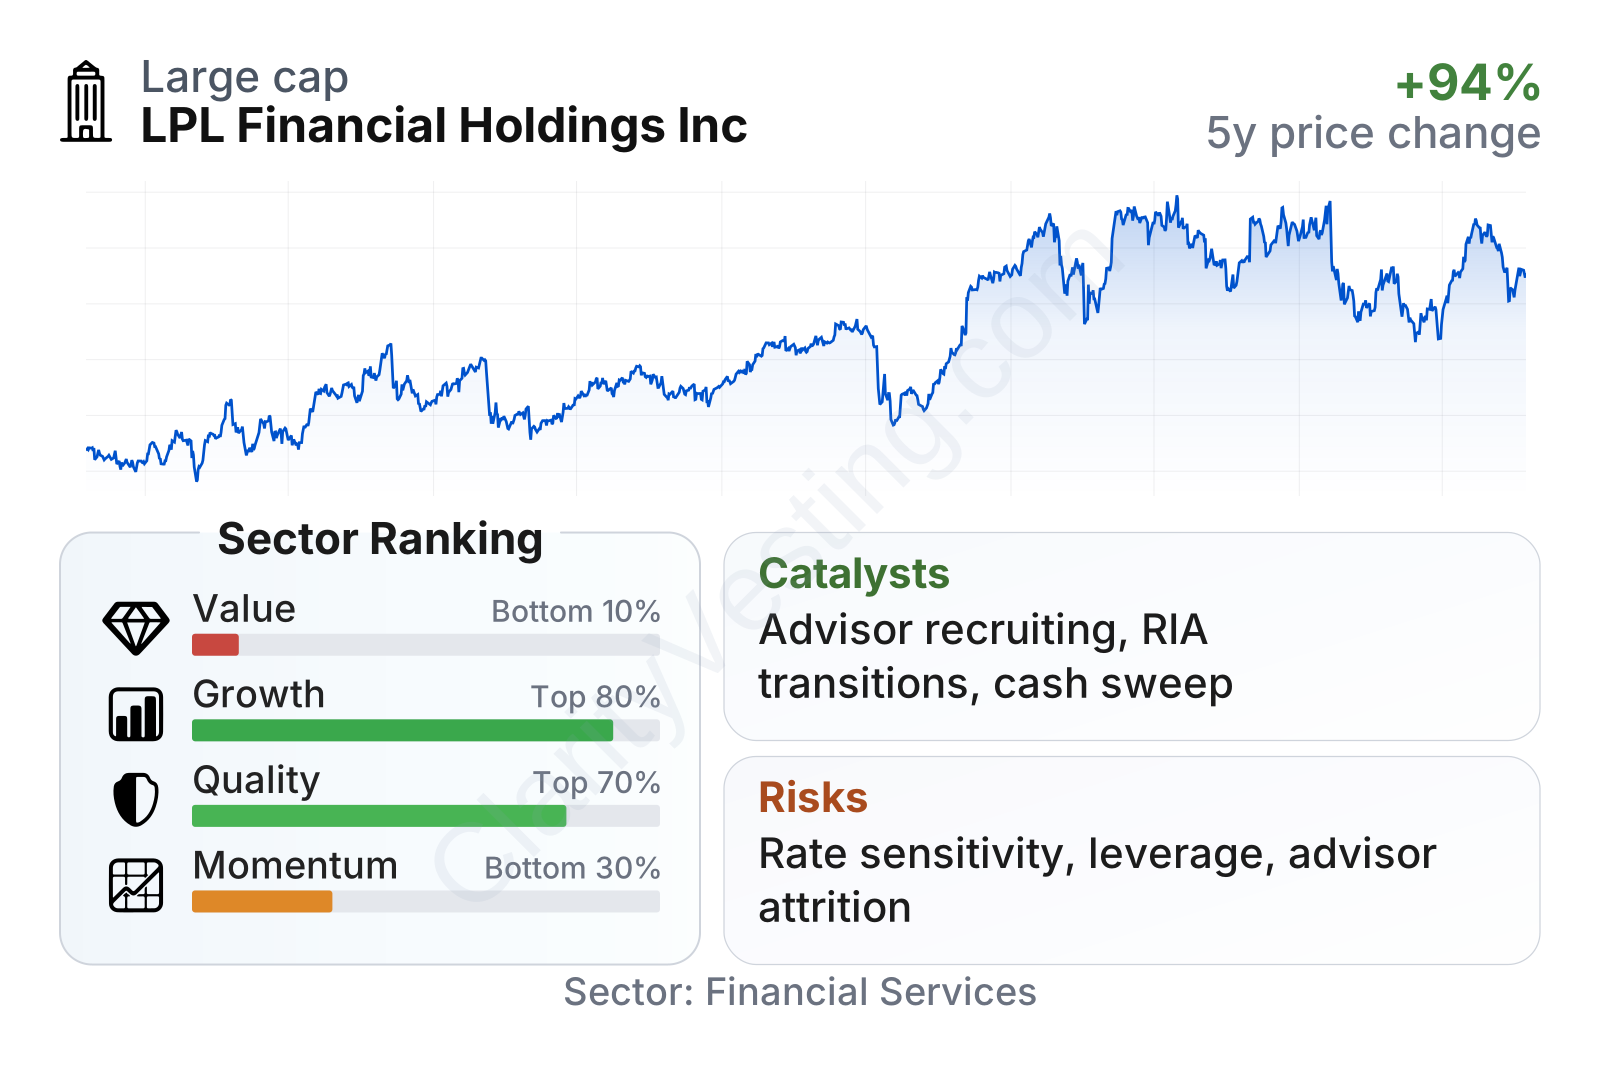
LPL stands out as a large capital-markets company with relatively low share-price volatility, reflected in a beta well below 1. Operationally, the company ranks well on growth and above average on quality, but it screens poorly on value and recent momentum. Revenue growth is clearly stronger than the sector median, and returns on equity and assets remain above typical peers. On the other hand, the stock trades at a much richer earnings and book-value multiple than most financial companies, while free cash flow is currently negative and recent share-price performance has lagged the broader sector.
The stock’s multi-year path has still been positive overall, but it has also been uneven. After a strong climb through 2024 and parts of 2025, the shares became much more volatile, which suggests the market is weighing strong business expansion against questions around valuation, interest-rate sensitivity, and integration execution.
Growth
LPL operates in a favorable long-term area of financial services. Wealth management has structural support from an aging population needing retirement advice, growing household financial assets, and the ongoing shift of advisors away from traditional wirehouses and bank-employed models toward independence. That industry migration plays directly into LPL’s model, because the company is effectively a platform provider for advisors who want more autonomy but still need scale, custody, and compliance infrastructure.
The company’s strategy also makes sense for future expansion. LPL has consistently grown by recruiting advisors, deepening relationships with institutions, and completing acquisitions or conversions that bring additional advisor assets onto its platform. This is one of the clearest growth levers in the business: once an advisor or institution moves over, LPL can generate recurring revenue from custody, advisory programs, cash balances, and service fees.
Recent operating trends support that view. Revenue growth of about 36% year over year is far ahead of the sector median, and five-year revenue per share growth of about 23% annually is also strong. Book value per share has compounded at nearly 35% over five years, which is an unusually fast pace for a financial company and suggests meaningful balance-sheet expansion alongside business scaling.
Earnings per share have shown a strong longer-term climb from 2021 through 2025. That indicates the platform has been able to convert much of its asset and advisor growth into higher earnings over time, even if the path has not been perfectly linear.
The rise in book value per share has been especially notable. For a financial firm, that kind of increase often signals that retained earnings, acquisition-driven scale, and capital deployment have meaningfully increased the company’s economic base.
A major catalyst is continued advisor migration toward independent and hybrid models. Another is the company’s ability to win larger institutional relationships, including banks, credit unions, and enterprise advisor groups looking to outsource wealth platforms. If interest rates remain at levels that still support cash-sweep economics, that can also continue to help revenue, although this is a less predictable tailwind than advisor recruitment. In addition, LPL’s scale gives it room to spread technology and compliance investments across a wider asset base, which can improve efficiency over time if execution remains disciplined.
Risks
This article is for informational purposes only and does not constitute financial advice. Some content is AI-generated. See Disclaimer


