Stock Analysis · Live Oak Bancshares Inc (LOB)
Overview
Live Oak Bancshares is the parent company of Live Oak Bank, a U.S. bank focused mainly on lending to small businesses. Instead of trying to be a broad consumer bank, it concentrates on specific commercial niches such as veterinary practices, pharmacies, healthcare, agriculture, franchise businesses, and other professional or service-based industries. The company also has a meaningful technology and banking-services angle through businesses connected to digital loan origination, deposit gathering, and platform capabilities for financial institutions.
Its business model is centered on earning interest from loans and securities, while also collecting fees tied to loan sales, servicing, and banking-related services. A large part of its lending activity has historically been connected to government-guaranteed Small Business Administration lending, especially SBA 7(a), which can reduce credit risk on guaranteed portions and create fee income when loans are sold.
Based on recent annual reporting, Live Oak’s revenue mix is still dominated by traditional banking income, with noninterest revenue acting as a secondary contributor. The main sources are approximately:
- Net interest income: about 80% to 90% of total revenue. This is the spread between interest earned on loans and investments and interest paid on deposits and borrowings.
- Noninterest income: about 10% to 20% of total revenue. This includes gains on sale of loans, loan servicing revenue, deposit-related fees, and income from technology or other banking-related activities.
- Within lending activity, SBA-related originations remain an important driver, because they support both recurring interest income and sale gains, even if the exact share of total company revenue can vary from year to year.
Over the last several years, total revenue has climbed strongly, moving from a little above $500 million in 2021 to just over $1.0 billion in 2025. At the same time, rising funding costs have absorbed a much larger share of that revenue, which helps explain why profit growth has not matched revenue growth one-for-one.
The business has clearly expanded its revenue base, but the expense mix shows that interest expense became much heavier after rates moved up. That makes Live Oak’s long-term appeal closely tied to whether it can keep growing loans and deposits while restoring stronger profitability.
Key Figures
| Metric | Value | Sector ⓘ |
|---|---|---|
| Date | Oct 03, 2026 | |
| Context | ||
| Sector | Financial Services | |
| Industry | Banks - Regional | |
| Market Cap ⓘ | $1.68B | |
| Beta ⓘ | 1.87 | |
Value (Cheapness) | ||
| P/E Ratio ⓘ | 12.79 | 12.60 |
| P/B Ratio ⓘ | 1.30 | 1.23 |
| FCF Yield ⓘ | -3.12% | 10.16% |
| Dividend Yield ⓘ | 0.33% | 2.96% |
| EBIT / EV ⓘ | 21.38% | 7.77% |
| PEG ⓘ | N/A | |
Growth (Business expansion) | ||
| Revenue Growth ⓘ | 12.20% | 9.50% |
| RPS Growth (5Y CAGR) ⓘ | 18.94% | 12.10% |
| EPS Growth (5Y CAGR) ⓘ | -8.86% | -9.45% |
| BVPS Growth (5Y CAGR) ⓘ | 14.11% | 5.01% |
| Margin Growth (5Y Trend) ⓘ | -26.16% | -4.07% |
| FCF Growth (5Y CAGR) ⓘ | N/A | 4.96% |
| DPS Growth (5Y CAGR) ⓘ | 12.51% | 8.79% |
Quality (Business durability) | ||
| ROIC (Latest) ⓘ | 10.85% | 9.60% |
| ROE (Latest) ⓘ | 10.91% | 13.84% |
| ROA (Latest) ⓘ | 0.90% | 1.53% |
| ROIC (5Y Median) ⓘ | 8.75% | 7.86% |
| ROE (5Y Median) ⓘ | 10.58% | 12.20% |
| ROA (5Y Median) ⓘ | 0.74% | 1.29% |
| Net Debt / EBIT (Latest) ⓘ | 3.42 | 0.91 |
| Net Debt / EBIT (5Y Median) ⓘ | -4.74 | 0.74 |
| Net Debt / EBITDA (Latest) ⓘ | 3.06 | 0.97 |
| Operating Margin (Latest) ⓘ | 18.75% | 22.12% |
| Operating Margin (5Y Median) ⓘ | 15.46% | 24.39% |
| Debt to Equity (Latest) ⓘ | 7.60% | 60.37% |
| Profit Margin (Latest) ⓘ | 26.51% | 26.62% |
| Free Cash Flow (Latest) ⓘ | -$52.23M | |
Momentum (Price trend) | ||
| 3Y Return ⓘ | +30.12% | +89.23% |
| 12M Return (excl. last month) ⓘ | +0.31% | +17.35% |
| 6M Return ⓘ | +9.16% | +10.00% |
| Price vs. 200-Day MA ⓘ | -4.54% | +3.73% |
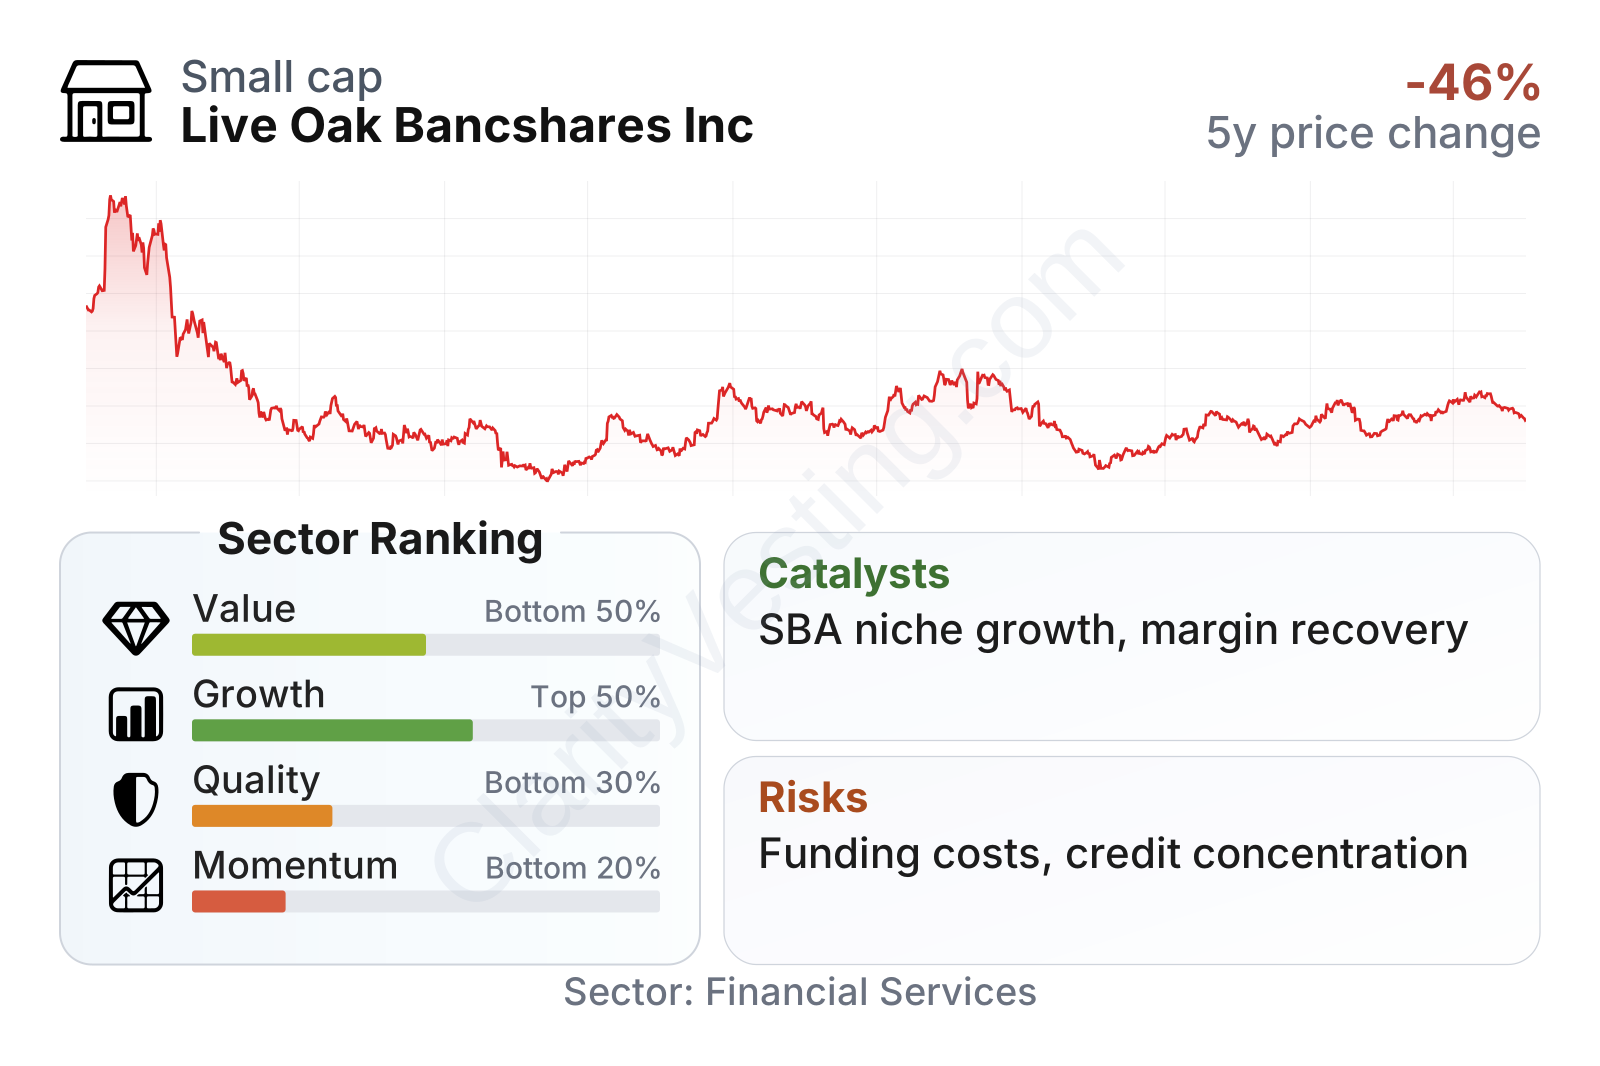
Live Oak is a smaller publicly traded bank with above-average share-price volatility, which fits a lender that is more specialized and growth-oriented than many traditional regional banks. The overall metric profile is mixed: growth ranks in the upper half of the sector, but quality, momentum, and value are less convincing. Revenue growth is ahead of the sector median, and book value growth over five years stands out positively. On the other hand, returns on equity and assets remain below typical sector levels, free cash flow is negative, and recent stock performance has lagged much of the regional banking group despite some improvement over the last six months.
The stock-price history also shows that the market has repeatedly re-rated the company as interest rates, credit conditions, and profit expectations changed. That pattern matters for long-term readers because it suggests Live Oak is not being treated like a steady, low-drama bank; it is being valued more like a niche lender whose earnings path can swing meaningfully.
Growth
Live Oak operates in an area that still has room for expansion: small-business lending, especially in specialized industries where underwriting knowledge matters. That is a favorable place to be over the long run because many small businesses value speed, expertise, and relationship-based financing, while large banks often prioritize larger clients or more standardized loan categories. The company’s digital-first model and national reach also give it a wider footprint than a typical regional bank limited by branch geography.
Its strategy is coherent. Management has built the franchise around vertical specialization, SBA lending expertise, and technology-enabled operations. In practical terms, that means Live Oak tries to win business by understanding the economics of specific professions better than a generalist bank would. If executed well, that can support loan growth, fee generation from loan sales, and deposit gathering from business customers who may later use additional banking services.
Earnings per share show that growth has not been linear. Profit peaked much higher in 2021, dropped sharply as the rate environment changed, and has only partially recovered since then. That uneven pattern suggests the franchise can generate strong earnings in favorable conditions, but it also shows how exposed results are to funding costs, gain-on-sale conditions, and credit normalization.
Book value per share paints a better long-term picture than earnings alone. After a setback in 2023, book value rebounded strongly and continued higher through 2025. That matters for a bank because book value is a simple way to track how much net worth is being built over time. Live Oak’s five-year book value growth rate is well ahead of the sector median, which supports the idea that the company has continued to build franchise value despite profit volatility.
A major catalyst is the possibility of a more favorable rate backdrop for bank margins. If deposit costs stabilize or ease while loan production remains healthy, profitability could improve more quickly than revenue alone suggests. Another potential growth driver is continued share gains in SBA and niche small-business lending, where reputation and underwriting specialization can be hard to replicate. The company’s technology operations and embedded digital capabilities may also create cross-selling opportunities and operational efficiency benefits over time.
Recent company reporting and investor communications have continued to emphasize loan origination capacity, deposit franchise development, and specialized industry channels. Those are meaningful because they point to organic expansion rather than reliance on large acquisitions. For a business of Live Oak’s size, consistent execution in those lanes could still move results materially.
Risks
This article is for informational purposes only and does not constitute financial advice. Some content is AI-generated. See Disclaimer


