Stock Analysis · Lantheus Holdings Inc (LNTH)
Overview
Lantheus Holdings is a healthcare company focused on diagnostic imaging and targeted radiopharmaceuticals. In simple terms, it develops and sells products that help doctors find disease inside the body, especially in cancer and cardiology. Its best-known franchise is in prostate cancer imaging, where its products are used with PET scans to detect and monitor disease more accurately.
The business has shifted meaningfully over the last few years. Lantheus was once better known for more traditional imaging agents, but now a large part of its profile comes from precision diagnostics and radiopharmaceutical-related products. That matters for long-term analysis because these areas are among the faster-growing parts of medical imaging, supported by better cancer screening, more targeted treatments, and broader use of PET imaging.
Based on recent company filings, revenue is concentrated in a few key products and services, led by prostate cancer imaging. Approximate revenue sources are:
- PYLARIFY and related prostate cancer PET imaging revenue: approximately 50% to 55% of total revenue. This includes sales of the imaging agent itself and related service activity tied to prostate cancer scans.
- Strategic partnerships, licensing, and radiopharmaceutical platform-related revenue: approximately 15% to 20%. This can include milestone-related activity, supply arrangements, and collaboration economics.
- DEFINITY: approximately 15% to 20%. This is an ultrasound contrast imaging product mainly used in cardiology.
- TechneLite and other legacy imaging products: approximately 10% to 15%. These products support nuclear imaging procedures and generator-related workflows.
- Other products and services: less significant individually, together roughly 5% to 10%.
This revenue mix shows both strength and concentration. Lantheus has built a valuable position in a high-growth niche, but a large share of the business still depends on a limited number of major products.
The company’s income profile also improved sharply from 2021 through 2024, with revenue and gross profit rising much faster than operating costs. In 2025, revenue was flatter and operating income came down from the 2024 peak, which suggests the next phase may depend less on pure volume expansion and more on execution, new product launches, and pipeline progress.
The multiyear pattern shows a business that scaled rapidly, moving from losses in 2021 to substantial profitability and cash generation. More recently, sales have remained high, but expenses have also risen, especially in commercial and development spending, which is normal for a company trying to expand beyond one leading product.
Key Figures
| Metric | Value | Sector ⓘ |
|---|---|---|
| Date | Oct 17, 2026 | |
| Context | ||
| Sector | Healthcare | |
| Industry | Drug Manufacturers - Specialty & Generic | |
| Market Cap ⓘ | $6.53B | |
| Beta ⓘ | -0.06 | |
Value (Cheapness) | ||
| P/E Ratio ⓘ | 24.21 | 24.79 |
| P/B Ratio ⓘ | 5.15 | 3.08 |
| FCF Yield ⓘ | 5.94% | 3.15% |
| Dividend Yield ⓘ | N/A | 1.94% |
| EBIT / EV ⓘ | 5.83% | 0.57% |
| PEG ⓘ | 0.61 | |
Growth (Business expansion) | ||
| Revenue Growth ⓘ | 2.70% | 7.45% |
| RPS Growth (5Y CAGR) ⓘ | 37.50% | 8.61% |
| EPS Growth (5Y CAGR) ⓘ | -10.54% | -17.81% |
| BVPS Growth (5Y CAGR) ⓘ | 23.33% | 3.72% |
| Margin Growth (5Y Trend) ⓘ | 37.46% | -0.62% |
| FCF Growth (5Y CAGR) ⓘ | 70.62% | 1.04% |
| DPS Growth (5Y CAGR) ⓘ | N/A | 6.77% |
Quality (Business durability) | ||
| ROIC (Latest) ⓘ | 16.55% | 3.24% |
| ROA (Latest) ⓘ | 11.74% | 3.01% |
| ROIC (5Y Median) ⓘ | 14.98% | 4.60% |
| ROA (5Y Median) ⓘ | 11.10% | 1.89% |
| Net Debt / EBIT (Latest) ⓘ | 0.08 | 1.34 |
| Net Debt / EBIT (5Y Median) ⓘ | 0.28 | 1.84 |
| Net Debt / EBITDA (Latest) ⓘ | 0.07 | 1.00 |
| Net Debt / Assets ⓘ | 1.31% | 5.45% |
| EBITDA / Interest ⓘ | 23.79 | 9.64 |
| Operating Margin (Latest) ⓘ | 24.60% | 9.27% |
| Operating Margin (5Y Median) ⓘ | 21.64% | 7.38% |
| Debt to Equity (Latest) ⓘ | 47.64% | 28.58% |
| Profit Margin (Latest) ⓘ | 17.69% | 3.59% |
| Free Cash Flow (Latest) ⓘ | $387.83M | |
Momentum (Price trend) | ||
| 3Y Return ⓘ | +43.79% | +42.80% |
| 12M Return (excl. last month) ⓘ | +94.68% | +18.50% |
| 6M Return ⓘ | +19.12% | +7.57% |
| Price vs. 200-Day MA ⓘ | +11.61% | +5.12% |
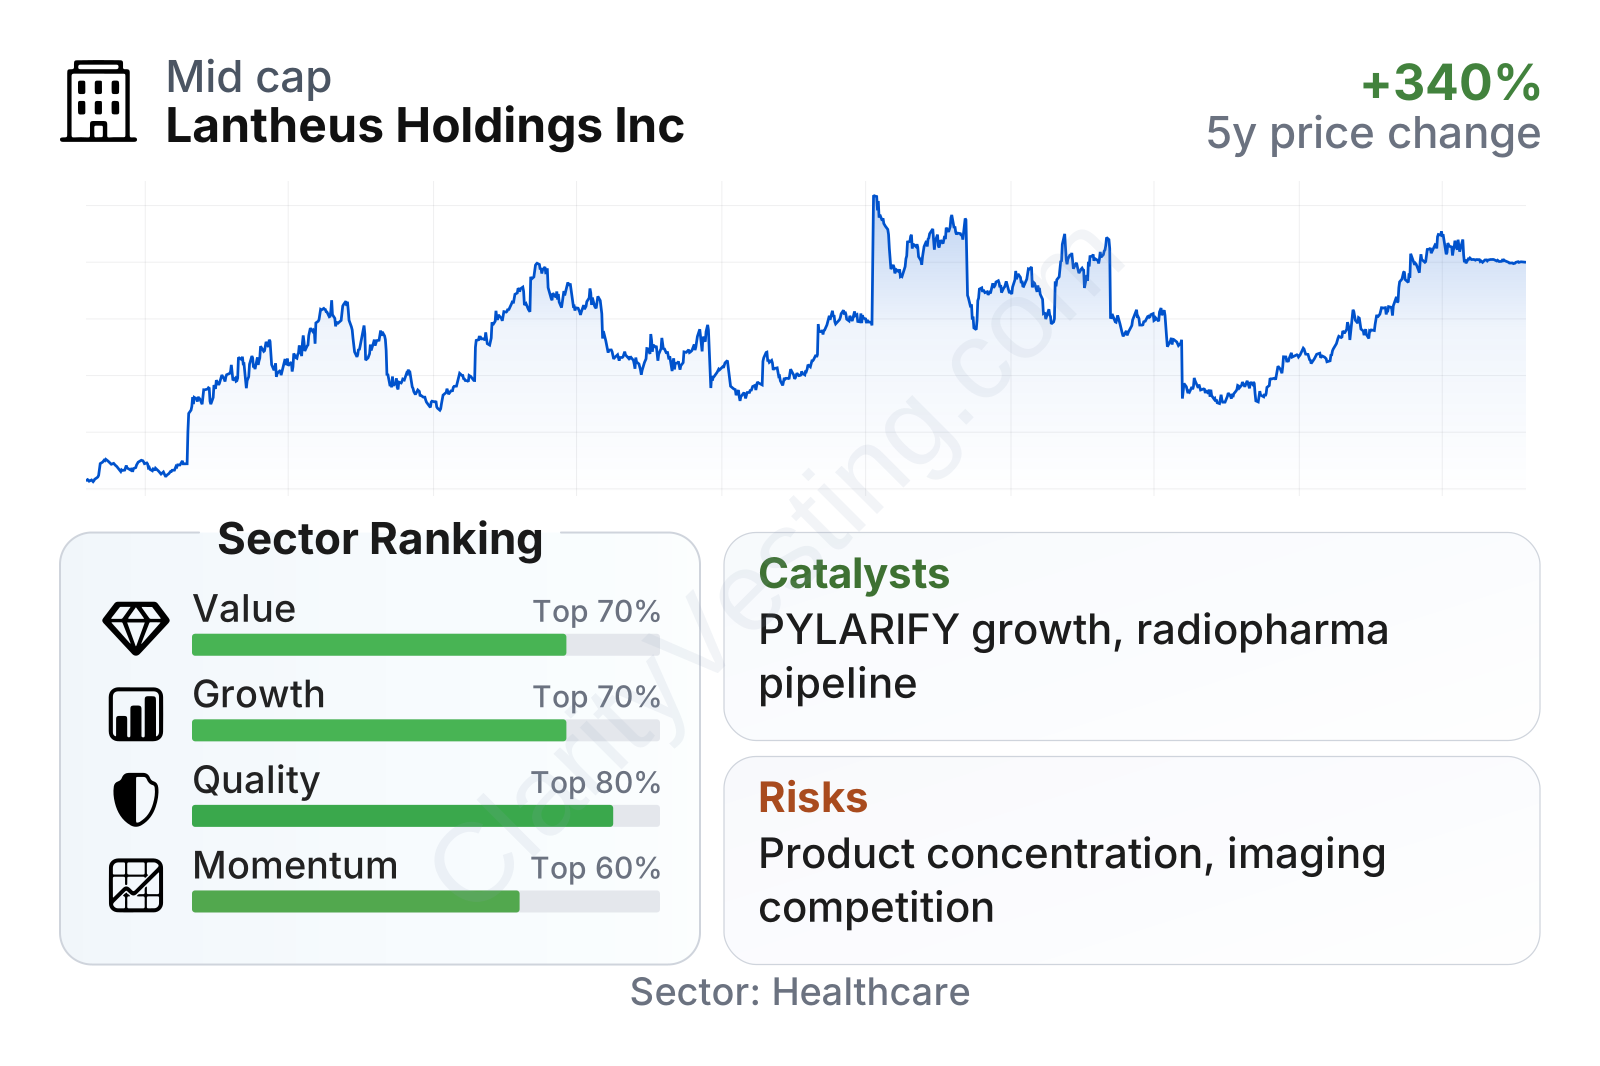
Lantheus sits in the mid-cap range within healthcare and stands out more for profitability and cash generation than for low headline multiples. Its valuation is close to the sector median on earnings, but cash-flow-based measures look stronger than many peers. Quality metrics are particularly notable: returns on capital, returns on assets, and operating margins are well above sector norms. Growth remains solid over a multiyear period, although recent year-over-year revenue expansion has slowed materially from the exceptional pace seen earlier.
Growth
Lantheus operates in an attractive part of healthcare. Nuclear medicine, PET imaging, and radiopharmaceuticals are gaining attention because they can help physicians detect disease earlier and match patients with more targeted treatments. Prostate cancer imaging has been one of the clearest growth areas, and Lantheus already has a meaningful installed presence through PYLARIFY. That gives the company a platform advantage as hospitals and imaging centers expand use of advanced scans.
The company’s strategy broadly makes sense for future growth. It is using cash generated from current products to support internal development, commercial expansion, and external deals in radiopharmaceuticals. That approach can work well in this industry because scale matters in manufacturing, regulatory know-how, distribution logistics, and physician relationships. Lantheus is not trying to build an entirely new market from scratch; it is building around areas where demand already exists and appears to be deepening.
The growth chart shows two different phases. First came an extraordinary step-up in sales during 2022 and 2023. More recently, growth has cooled to low single digits, with even a brief decline in 2025 before returning to modest expansion in 2026. For a long-term view, that slowdown is important: the business is no longer in a pure breakout phase, so future upside likely depends on new indications, new assets, and better monetization of its broader portfolio rather than repeating the initial launch curve.
Cash generation remains a major positive. Free cash flow rose dramatically from early levels and has stayed robust even with some volatility. That gives Lantheus room to fund research, partnerships, manufacturing capacity, and acquisitions without looking financially stretched. In a sector where many growth-oriented companies consume cash for years, this is a meaningful differentiator.
As for catalysts, several stand out. Continued expansion in prostate cancer imaging remains the clearest one, especially if scan volumes keep rising across community care settings. Another is the company’s broader radiopharmaceutical pipeline and deal activity, which could diversify revenue away from its leading franchise. Manufacturing and distribution capacity also matter: in radiopharmaceuticals, being able to reliably deliver product on time can be as important as having a strong drug.
Recent company communications have also emphasized pipeline development and strategic transactions aimed at strengthening the oncology portfolio. For long-term analysis, that is significant because it suggests management is trying to turn Lantheus from a successful product company into a more durable platform business.
Risks
This article is for informational purposes only and does not constitute financial advice. Some content is AI-generated. See Disclaimer


